filmov
tv
How to calculate band gap energy from UV-Vis reflection (DRS) data in origin

Показать описание
#bandgapenergy #originpro #sayphysics
0:00 how to calculate bandgap energy from UV-Vis reflection (DRS) data in origin
1:15 band gap calculation from DRS data in origin
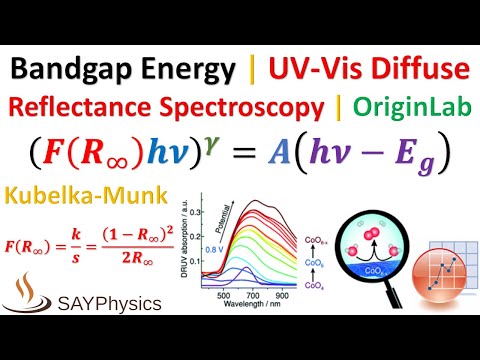
3:00 band gap energy using Kubelka Munk function (DRS data) in origin
4:50 band gap calculation using Kubelka Munk function on DRS data
6:55 diffused reflectance spectroscopy data bandgap calculation
8:10 band gap (Eg) of UV-Vis reflection data using Tauc plot
10:30 band gap (Eg) calculation of UV-Vis reflection spectra
Exercise File (Origin File):
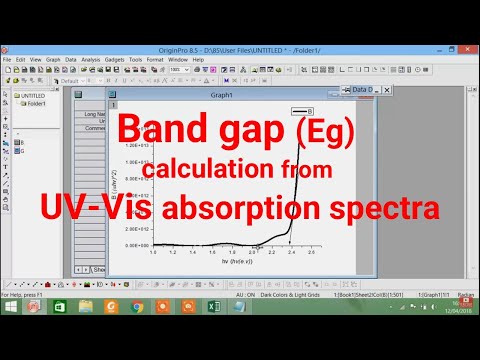
In this YouTube video, viewers will learn how to calculate the band gap energy of a semiconductor material using UV-Vis reflection (DRS) data in Origin software. The video will begin by providing a brief overview of band gap energy and its importance in materials science and engineering. Next, the presenter will demonstrate how to import and process the DRS data in Origin, and create a Tauc plot by plotting (αhν)^2 as a function of photon energy (hν). The linear portion of the curve will be identified and extrapolated to the x-axis intercept to determine the band gap energy. Throughout the video, the presenter will provide helpful tips and explanations to help viewers understand the process and troubleshoot common issues. By the end of the video, viewers will have a clear understanding of how to calculate band gap energy from UV-Vis reflection data in Origin, which can be applied to a wide range of materials research and development projects.
"Band gap energy calculation" "UV-Vis reflection data analysis" "DRS data analysis" "OriginLab tutorial" "Data plotting" "Spectral analysis" "Optical properties of materials" "Semiconductor characterization" "Electronic band structure" "Absorption spectroscopy" "Optical absorption spectra" "Energy bandgap measurement" "Material science analysis" "Quantitative analysis" "Spectroscopic techniques" "Thin film characterization" "Electronic properties of materials" "Photovoltaic materials" "Spectral data processing" "UV-Vis spectroscopy analysis"
All UV-Vis Analysis Video Tutorials:
1. How to calculate band gap energy from UV-Vis absorption
2. Calculate band gap energy from UV-Vis absorbance
3. How to calculate band gap energy from UV-Vis reflection (DRS) data
4. How to calculate band gap energy from photoluminescence (PL) data
5. Band gap energy with baseline correction using Tauc plot from UV-Vis absorbance data
6. How to estimate the size of nanoparticles from UV-Vis absorbance data
7. Nanoparticle size, morphology, concentration and distribution from UV-Vis absorbance data
8. Calculate concentration from UV-Vis absorbance using Beer-Lambert's law
9. How to calculate Urbach energy from UV-Vis absorbance data
10. How to plot and normalize FTIR and UV-VIS data
11. Absorption coefficient α calculation from UV-Vis absorbance data
Reference article:
Bibliographical review for reflectance of diffusing media
How is band gap calculated from UV-Vis reflectance spectra?
How do you find the band gap from the UV-VIS result?
How is band gap energy calculated?
How do you find the energy band gap of a semiconductor?
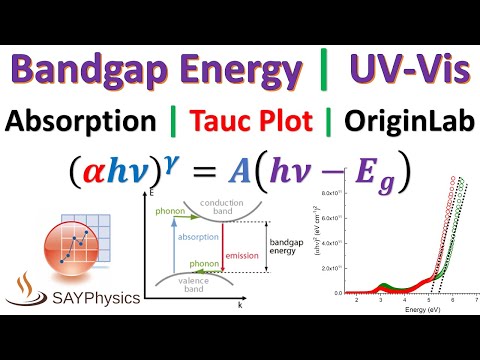
Tauc used an equation in 1968 to calculate the absorption edges (bandgaps) of amorphous Ge and Si from their absorption data.
(αhν)γ=A(hν-Eg)
In this equation, α is the absorption coefficient, h is Planck’s constant, υ is the frequency of the incident photon, A is a proportionality constant (which is determined by the index of refraction, electron, and hole effective masses; however, it is usually taken as 1 for amorphous materials), and Eg is the bandgap energy. The important term is the exponent γ, which denotes the nature of the electronic transition, that is, when
γ=2 it is a direct allowed transition, and when it is equal to 1/2, it is an indirect allowed transition.
For γ=2/3 it is a direct forbidden transition, and for γ=1/3 an indirect forbidden transition.
Typically, the allowed transitions dominate the basic absorption processes, giving either direct or indirect transitions.
Thus, the basic procedure for a Tauc analysis is to acquire optical absorbance data for a sample in question that spans a range of energies from below the bandgap transition to above it.
Plotting the (αhν)γ versus (hν) is a matter of testing γ=2 or γ=1/2 to compare which provides
the better fit and thus identifies the correct transition type.
0:00 how to calculate bandgap energy from UV-Vis reflection (DRS) data in origin
1:15 band gap calculation from DRS data in origin
3:00 band gap energy using Kubelka Munk function (DRS data) in origin
4:50 band gap calculation using Kubelka Munk function on DRS data
6:55 diffused reflectance spectroscopy data bandgap calculation
8:10 band gap (Eg) of UV-Vis reflection data using Tauc plot
10:30 band gap (Eg) calculation of UV-Vis reflection spectra
Exercise File (Origin File):
In this YouTube video, viewers will learn how to calculate the band gap energy of a semiconductor material using UV-Vis reflection (DRS) data in Origin software. The video will begin by providing a brief overview of band gap energy and its importance in materials science and engineering. Next, the presenter will demonstrate how to import and process the DRS data in Origin, and create a Tauc plot by plotting (αhν)^2 as a function of photon energy (hν). The linear portion of the curve will be identified and extrapolated to the x-axis intercept to determine the band gap energy. Throughout the video, the presenter will provide helpful tips and explanations to help viewers understand the process and troubleshoot common issues. By the end of the video, viewers will have a clear understanding of how to calculate band gap energy from UV-Vis reflection data in Origin, which can be applied to a wide range of materials research and development projects.
"Band gap energy calculation" "UV-Vis reflection data analysis" "DRS data analysis" "OriginLab tutorial" "Data plotting" "Spectral analysis" "Optical properties of materials" "Semiconductor characterization" "Electronic band structure" "Absorption spectroscopy" "Optical absorption spectra" "Energy bandgap measurement" "Material science analysis" "Quantitative analysis" "Spectroscopic techniques" "Thin film characterization" "Electronic properties of materials" "Photovoltaic materials" "Spectral data processing" "UV-Vis spectroscopy analysis"
All UV-Vis Analysis Video Tutorials:
1. How to calculate band gap energy from UV-Vis absorption
2. Calculate band gap energy from UV-Vis absorbance
3. How to calculate band gap energy from UV-Vis reflection (DRS) data
4. How to calculate band gap energy from photoluminescence (PL) data
5. Band gap energy with baseline correction using Tauc plot from UV-Vis absorbance data
6. How to estimate the size of nanoparticles from UV-Vis absorbance data
7. Nanoparticle size, morphology, concentration and distribution from UV-Vis absorbance data
8. Calculate concentration from UV-Vis absorbance using Beer-Lambert's law
9. How to calculate Urbach energy from UV-Vis absorbance data
10. How to plot and normalize FTIR and UV-VIS data
11. Absorption coefficient α calculation from UV-Vis absorbance data
Reference article:
Bibliographical review for reflectance of diffusing media
How is band gap calculated from UV-Vis reflectance spectra?
How do you find the band gap from the UV-VIS result?
How is band gap energy calculated?
How do you find the energy band gap of a semiconductor?
Tauc used an equation in 1968 to calculate the absorption edges (bandgaps) of amorphous Ge and Si from their absorption data.
(αhν)γ=A(hν-Eg)
In this equation, α is the absorption coefficient, h is Planck’s constant, υ is the frequency of the incident photon, A is a proportionality constant (which is determined by the index of refraction, electron, and hole effective masses; however, it is usually taken as 1 for amorphous materials), and Eg is the bandgap energy. The important term is the exponent γ, which denotes the nature of the electronic transition, that is, when
γ=2 it is a direct allowed transition, and when it is equal to 1/2, it is an indirect allowed transition.
For γ=2/3 it is a direct forbidden transition, and for γ=1/3 an indirect forbidden transition.
Typically, the allowed transitions dominate the basic absorption processes, giving either direct or indirect transitions.
Thus, the basic procedure for a Tauc analysis is to acquire optical absorbance data for a sample in question that spans a range of energies from below the bandgap transition to above it.
Plotting the (αhν)γ versus (hν) is a matter of testing γ=2 or γ=1/2 to compare which provides
the better fit and thus identifies the correct transition type.
 0:06:07
How to find bandgap using Tauc's plot Method | Graphene oxide | UV-Visible spectroscopy
 0:16:47
Band gap energy from absorption data using the Tauc plot method - 03
 0:11:55
How to calculate band gap energy from UV-Vis absorption using Origin
 0:18:43
How to know a material has either direct or indirect bandgap energy - 18
 0:10:39
How to calculate band gap energy from UV-Vis reflection (DRS) data in origin
 0:04:48
Calculate the BAND-GAP from SCF calculation - QUANTUM ESPRESSO [Tutorial]
 0:07:51
02 Direct Bandgap Calculation from Absorbance data
 0:11:34
Band gap (Eg) calculation of UV-Vis spectroscopy from absorption spectra
 1:36:15
Beyond CMOS technology and advanced nano electronics with Nanodcal S/W
 0:05:45
Optical bandgap energy calculation by tauc plot method | UV-Visible Spectroscopy |
 0:08:11
How to find bandgap energy using Tauc's plot Method | Indirect bandgap | UV-Visible spectroscop...
 0:21:43
Bandgap energy using Kubelka Munk function (DRS data Analysis) - 07
 0:02:12
Exabyte.io Tutorial: Calculate Electronic Band Gap and Density of States with HSE and QE
 0:04:03
Calculate the BAND GAP of material from SCF calculation using QUANTUM ESPRESSO - the easiest way
 0:15:01
Electronic Band Structure Calculation using Quantum ESPRESSO
 0:19:04
Band gap energy (Tauc Plot? Constant = 1240? Constant = 2 303?) - 01
 0:01:20
How to calculate band gap from uv vis absorption spectra?
 0:06:49
how to calculate band gap| Band gap using Tauc plot| Band gap energy from absorption data
 0:01:56
Calculate band gap energy from UV-Vis absorbance in origin
 0:17:42
How to calculate band gap and optical properties of nanomaterials by UV-Visible Spectroscopy
 0:12:05
How to calculate band gap energy from photoluminescence (PL) in origin
 0:00:12
To determine the band gap of a semiconductor using pn junction diode #experiment #physics
 0:04:22
Calculate the band gap energy of silicon at 450°K || Analog Electronics
 0:00:22
determine the band gap of semiconductor by four probe method #physics#experiment
Комментарии