filmov
tv
38_Cara plot LDOS menggunakan Gnuplot multiplot
Показать описание
This video tells us about how to make graphic using a gnuplot tools. This is a short video for making a better plotting by using filled curve mode. So here goes
# Gnuplot script file for plotting data in file "*.dat"
# This file is called estilo.p
#======================================================
#' STANDARD KEYS TO LATIN-AMERICAN SPEAKERS'
#======================================================
set termopt enhanced # Permite pone ^super/_{sub} indices
unset log # remove any log-scaling
unset label # remove any previous labels
set termoption dashed # Allows dash styles
set terminal pngcairo dashed # Dash style for png terminal
set xtic auto # set xtics automatically
set ytic auto # set ytics automatically
set palette gray
set encoding iso_8859_1 # Para poner acentos
# set grid
#======================================================
# Output settings terminals
#=====================================================
#
# Type of file you want to print the plot
# eps is the most recomended
# Default: Shows it on your screen
#set term pngcairo size 550 ,950 enhanced font "Times-New-Roman, 14"
set terminal postscript eps size 6.5,5.5 enhanced color 'Helvetica, 20' linewidth 2
set output "H2O-Pt(111).eps"
#=====================================================
# Canvas size of each plot
#=====================================================
xsize= 0.95 # Controls the image x size in the canvas 0.95
ysize= 0.265 # Controls the image y size in the canvas 0.265
#=======================================================
# 'STYLE LINES ADJUSTMENTS'
#=======================================================
set style line 5 lt 1 lw 1.2 pt 1 ps 0.9 lc rgb "gray80"
set style line 10 lt 1 lw 1.0 pt 2 ps 1.1 lc rgb "gray50"
set style line 11 lt 5 lw 1.4 pt 3 ps 1.1 lc rgb "gray20"
set arrow from 0, graph 0 to 0, graph 1 nohead ls 11
#=======================================================
#' Settings of multiplot'
#=======================================================
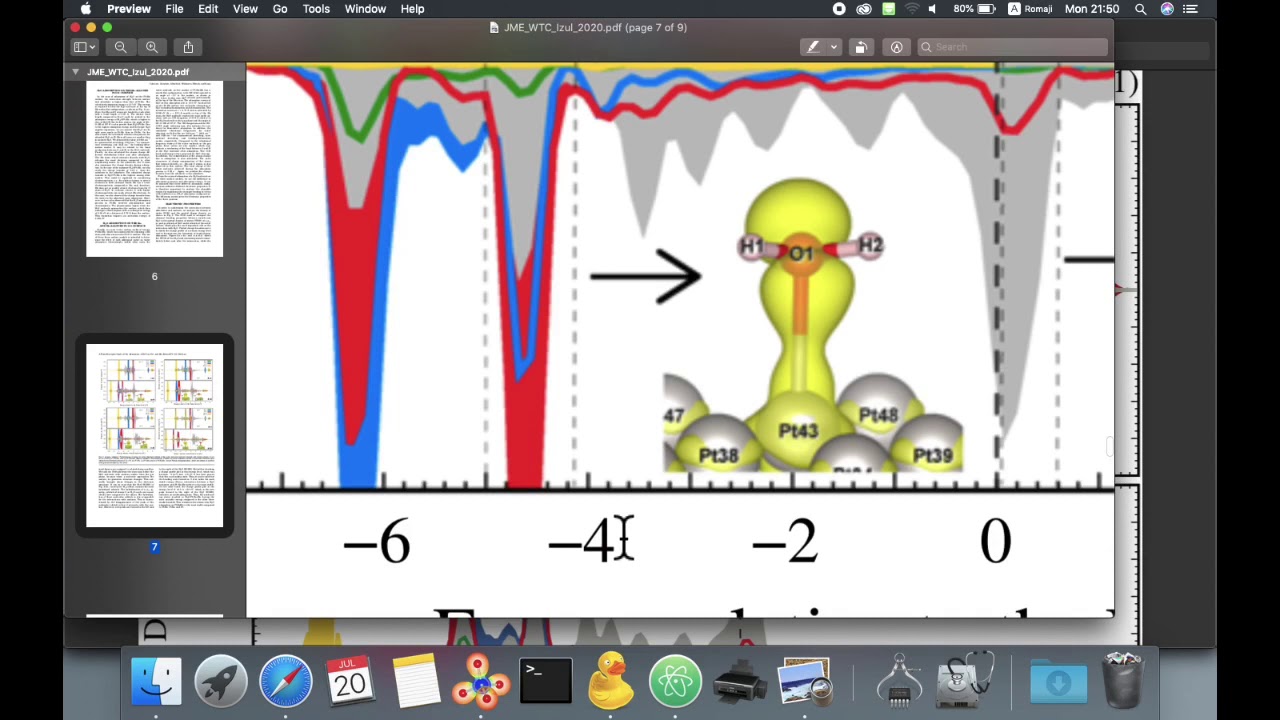
set multiplot layout 2,1 columnsfirst title "LDOS of H2O adsorb on Pt(111)"
set xlabel 'Energy [eV]'
set ylabel "Density of states [states/eV]" offset 1.0
set xr [-11:9]
set yr [-0.5:0.5]
set xtic 1
set ytic 0.1
set mxtics
set mytics
#=========================================================
# First plot
#=========================================================
# Reset keys
#'******************'
unset bmargin
unset tmargin
# Setting individual keys
#========================
set xlabel 'Energy relative to the Fermi level [eV]'
#set ylabel "Density of states [states/eV]" offset 0,15
set size xsize, ysize
set bmargin at screen 0.10 # Controls the y initial position 0.10
set tmargin at screen 0.50 # Controls the y final position 0.365
set label "After interaction" at 2,-0.35
#and so on
#and so on
#================================================================
# Second plot Sebelum berinteraksi
#================================================================
# 'RESET KEYS'
#'***********************'
unset label
unset xlabel
unset bmargin
unset tmargin
set format x " "
set mxtics
set size xsize, ysize
set tmargin at screen 0.91
set bmargin at screen 0.51
set label "Before interaction" at 2,-0.35
#and so on
#and so on
unset multiplot
reset
# Gnuplot script file for plotting data in file "*.dat"
# This file is called estilo.p
#======================================================
#' STANDARD KEYS TO LATIN-AMERICAN SPEAKERS'
#======================================================
set termopt enhanced # Permite pone ^super/_{sub} indices
unset log # remove any log-scaling
unset label # remove any previous labels
set termoption dashed # Allows dash styles
set terminal pngcairo dashed # Dash style for png terminal
set xtic auto # set xtics automatically
set ytic auto # set ytics automatically
set palette gray
set encoding iso_8859_1 # Para poner acentos
# set grid
#======================================================
# Output settings terminals
#=====================================================
#
# Type of file you want to print the plot
# eps is the most recomended
# Default: Shows it on your screen
#set term pngcairo size 550 ,950 enhanced font "Times-New-Roman, 14"
set terminal postscript eps size 6.5,5.5 enhanced color 'Helvetica, 20' linewidth 2
set output "H2O-Pt(111).eps"
#=====================================================
# Canvas size of each plot
#=====================================================
xsize= 0.95 # Controls the image x size in the canvas 0.95
ysize= 0.265 # Controls the image y size in the canvas 0.265
#=======================================================
# 'STYLE LINES ADJUSTMENTS'
#=======================================================
set style line 5 lt 1 lw 1.2 pt 1 ps 0.9 lc rgb "gray80"
set style line 10 lt 1 lw 1.0 pt 2 ps 1.1 lc rgb "gray50"
set style line 11 lt 5 lw 1.4 pt 3 ps 1.1 lc rgb "gray20"
set arrow from 0, graph 0 to 0, graph 1 nohead ls 11
#=======================================================
#' Settings of multiplot'
#=======================================================
set multiplot layout 2,1 columnsfirst title "LDOS of H2O adsorb on Pt(111)"
set xlabel 'Energy [eV]'
set ylabel "Density of states [states/eV]" offset 1.0
set xr [-11:9]
set yr [-0.5:0.5]
set xtic 1
set ytic 0.1
set mxtics
set mytics
#=========================================================
# First plot
#=========================================================
# Reset keys
#'******************'
unset bmargin
unset tmargin
# Setting individual keys
#========================
set xlabel 'Energy relative to the Fermi level [eV]'
#set ylabel "Density of states [states/eV]" offset 0,15
set size xsize, ysize
set bmargin at screen 0.10 # Controls the y initial position 0.10
set tmargin at screen 0.50 # Controls the y final position 0.365
set label "After interaction" at 2,-0.35
#and so on
#and so on
#================================================================
# Second plot Sebelum berinteraksi
#================================================================
# 'RESET KEYS'
#'***********************'
unset label
unset xlabel
unset bmargin
unset tmargin
set format x " "
set mxtics
set size xsize, ysize
set tmargin at screen 0.91
set bmargin at screen 0.51
set label "Before interaction" at 2,-0.35
#and so on
#and so on
unset multiplot
reset
 0:08:24
Tutorial Penggunaan GNUPlot Kelompok 8 - ST3 Telkom Purwokerto
 0:01:08
gnuplot for mac - test resolution
 0:28:46
How I make beautiful GRAPHS and PLOTS using LaTeX
 0:04:35
Tutorial: Extract data from a polar diagram with WebPlotDigitizer and plot it via plot.ly
 0:09:28
Automated terminal plotting with entr
 0:10:55
Read Data from text and csv Files using GNU Octave and Matlab
 0:06:36
Lecture 10 How to Calculate Band Structure Using SIESTA Simulation
 0:03:54
FISIKA KAUNTUM : ARTI FISIS FUNGSI GELOMBANG
 0:44:54
Routing in VANETs using ns3 - Part 2
 0:04:34
TensorFlow On Apple Silicon. Step-by-Step Instructions
Комментарии