filmov
tv
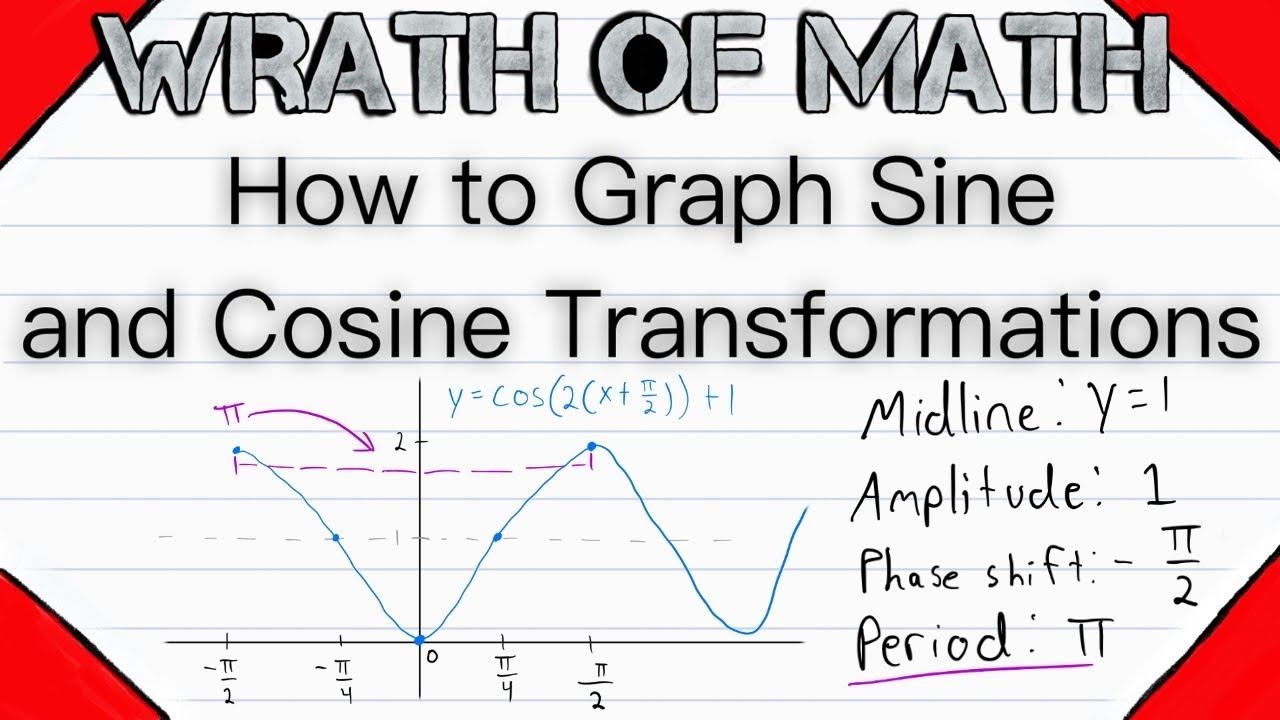
How to Graph Sine and Cosine Transformations | Period, Amplitude, Phase Shift, Vertical Shift
Показать описание
A step by step guide on how to graph transformations of sine and cosine functions! That's what we'll be providing in today's video math lesson. We'll go through a bunch of examples of graphing sine and cosine transformations, and we go into detail on every example and what needs to be considered in graphing these functions.
So how do we graph sine and cosine transformations? Because doing this involves many steps, I think it is best to settle into a uniform way of doing it, whatever works best for you! But in this video we'll use the method I think works best, which is outlined below.
1. Identify the midline
2. Make the coefficient of x positive, and identify the amplitude
3. Draw the midline on the graph and label the high and low points of the function on the y-axis (the y coordinate of the midline plus the amplitude and minus the amplitude)
4. Identify the phase shift
5. Identify the period
6. Identify the quarter-preiods
7. Mark the phase shift on the x-axis, keeping the scale in mind
8. Label the x axis at points 1, 2, 3, and 4 quarter periods away from the phase shift (it may be helpful to first mark the end of the period on the x-axis which is the point that is 4 quarter periods away from the phase shift, this may help you keep an accurate sense of scale for how far apart each quarter-period should be)
9. Graph the key points
10. Sketch the graph
This list of instructions is a bit more thorough than the list I give in the video, the list in the video has 5 steps and we elaborate on those in the examples, as a few of the steps have multiple parts to them. This list is probably fairly confusing if you don't know how to graph these functions, but after you have
watched this lesson the list should be crystal clear.
SOLUTION TO PRACTICE PROBLEM:
The midline is y = -2.
The amplitude is -2 (thus, since this is a cosine function, our period will begin at its lowest point).
The phase shift is pi/4.
The period is 6*pi.
Since the phase shift is relatively small compared to the period, the phase shift should be marked close to the origin. Since we won't pass the origin in drawing this first period, it would be wise to mark the end of the period on the x-axis (which is at x = pi/4 + 6*pi) as a reference point. Then halfway between the phase shift and the end of the period is the third key point, and you know the rest of the story. Head over to Desmos to see if you got the key points right, the link to Desmos is above in this description.
I hope you find this video helpful, and be sure to ask any questions down in the comments!
********************************************************************
The outro music is by a favorite musician of mine named Vallow, who, upon my request, kindly gave me permission to use his music in my outros. I usually put my own music in the outros, but I love Vallow's music, and wanted to share it with those of you watching. Please check out all of his wonderful work.
********************************************************************
+WRATH OF MATH+
Follow Wrath of Math on...
 0:14:07
 0:00:27
 0:05:54
 0:03:43
 0:11:40
 0:08:05
 0:01:12
 0:13:01
 0:01:01
 0:00:10
 0:17:03
 0:00:19
 0:30:12
 0:00:54
 0:43:05
 1:07:58
 0:28:06
 0:01:00
 0:10:38
 0:15:21
 0:07:40
 0:05:04
 0:01:00
 0:04:14