filmov
tv
Power BI: How to Create Aging Reports 👵 by Bins/Buckets (Showing Open/Overdue Items)

Показать описание
In this Power BI Question & Answer Episode, we cover a question by Paolo Damiani (LearnPowerBI Member): How to Create Bette Aging Reports.
Do you have a Power BI Question ❓
➔ Stuck trying to make a DAX Measure work
➔ Can't get the Query Editor steps right
➔ Visuals are just not behaving! Argh!
==▶️ Video Chapters==
00:00 Question: How to Create a Better Aging Report?
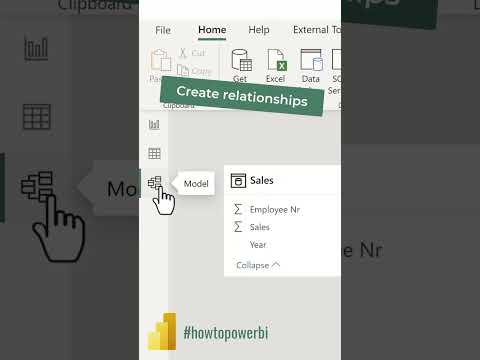
02:55 Step 1: Review the Model
03:48 Step 2: Review the Data (Human Learning)
05:42 Step 3A: Solve Using Query Editor
09:26 Step 3B: Query Editor, Add Status Column
11:10 Step 4: Adding Visualization to See Aging Report by Bins/Buckets
13:00 Wrap Up: Final Report and Update Bins
14:13 Next Steps: Custom Bins, Trend showing Open Count and Average Age
=============================================================
#PowerBI #PowerBIQuestion #PowerBIPro
===Most Popular Playlists===
⚡Power On!⚡
-Avi Singh
Do you have a Power BI Question ❓
➔ Stuck trying to make a DAX Measure work
➔ Can't get the Query Editor steps right
➔ Visuals are just not behaving! Argh!
==▶️ Video Chapters==
00:00 Question: How to Create a Better Aging Report?
02:55 Step 1: Review the Model
03:48 Step 2: Review the Data (Human Learning)
05:42 Step 3A: Solve Using Query Editor
09:26 Step 3B: Query Editor, Add Status Column
11:10 Step 4: Adding Visualization to See Aging Report by Bins/Buckets
13:00 Wrap Up: Final Report and Update Bins
14:13 Next Steps: Custom Bins, Trend showing Open Count and Average Age
=============================================================
#PowerBI #PowerBIQuestion #PowerBIPro
===Most Popular Playlists===
⚡Power On!⚡
-Avi Singh
 0:23:03
Power BI Tutorial For Beginners | Create Your First Dashboard Now (Practice Files included)
 0:12:32
Power BI Tutorial for Beginners
 0:15:10
How to create Power BI Dashboard (Report) in 7 Minutes in Power BI Desktop | @PavanLalwani
 0:41:07
How to Build Power BI Reports from Start to Finish
 0:11:15
Your first 10 minutes of Power BI - A no-nonsense getting started tutorial for beginners
 0:08:36
How to Create and Manage Relationships in Power BI | Microsoft Power BI for Beginners
 0:15:25
Create your first Power BI report (2021)
 0:15:20
Learn Power BI in Telugu and create your first report in 15 minutes
 0:23:34
How to integrate Power BI with Power Apps
 0:27:53
How to use Microsoft Power BI - Tutorial for Beginners
 0:20:22
5 DESIGN TRICKS that Make EVERY Power BI Report Look GREAT!
 0:44:14
Build THIS! Report DESIGN in Power BI | FULL TUTORIAL
 0:07:50
Creating a simple date table in Power BI
 0:06:33
Mastering Microsoft Power BI | Create Power BI Report in 5 Minutes | Tutorialspoint
 0:01:00
PowerBI: How to make a report in 5 Minutes
 3:02:18
Hands-On Power BI Tutorial 📊 Beginner to Pro [Full Course] 2023 Edition⚡
 0:10:55
How To Create these useful Power Bi Visuals that Excel Lacks
 0:00:59
Power BI Report in less than 1 MINUTE! #powerbi #short
 1:03:31
Power BI Tutorial From Beginner to Pro ⚡ Desktop to Dashboard in 60 Minutes ⏰
 0:00:15
Customer Analytics Dashboard in Power BI
 0:44:59
Power Bi tutorial for Beginners | Power BI Dashboard Project in Hindi | Power Bi Course 2023
 0:19:12
Create an Amazing Power BI Dashboard in 19 minutes | Amazon Prime Movies and TV Shows
 0:10:51
Power BI Tutorial for Beginners 6 - How to Create and Use Maps in Power BI
 0:03:42
10.2 How to create an account on Power BI Service? | Power BI Tutorial for Beginners
Комментарии