filmov
tv
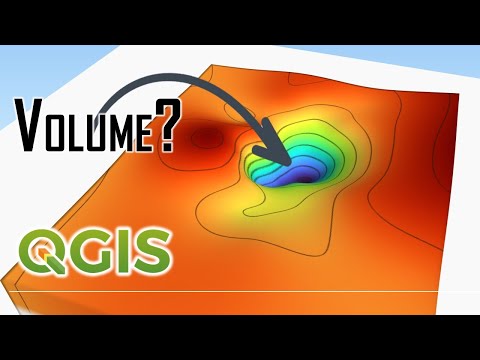
QGIS: Reservoir volume from DEM - Kajaki Reservoir, Afghanistan

Показать описание
How can I find the volume of a reservoir or lake from a DEM? In this video we will calculate the elevation-area-storage capacity for the Kajaki reservoir, Afghanistan from the SRTM30 DEM. We will use data from a 2006 bathymetric survey, which used an arbitrary datum, to find the elevation-volume relationship below the SRTM30 water mask, and then combine the two data sets together in Excel. I will take you step-by-step through all the processing from the DEM to the final elevation area-storage capacity curves.
Chapters:
00:00 Introduction
02:13 Step 1: DEM to Equal Area Projection
03:45 Step 2: Create contour lines
04:19 Step 3: Select maximum flooded area
07:13 Step 4: Edit maximum contour line
15:11 Step 5: Contour line to polygon
16:00 Step 6: Extract reservoir DEM
17:11 Step 7: Calculate Elevation-Area-Volume
21:13 How to get the DEM below the SRTM water mask
22:14 Step 8: Excel processing
25:20 Final remarks
Disclaimer: This video is based on open source data & the purpose is to train you in QGIS & Excel. I am not responsible for what you do with this information/methodology. You need to check you own data, work and conclusions.
*******************************************************************
Link to Kajaki reservoir data on Google Drive used for this video:
*******************************************************************
Some useful links:
Images used under Creative Commons License
Bathymetric survey
#QGIS #VolumefromDEM #Reservoirs
 0:26:55
QGIS: Reservoir volume from DEM - Kajaki Reservoir, Afghanistan
 0:08:29
Calculate volumes from a DEM in QGIS
 0:03:35
Polygon Volume Calculation Using DEM in QGIS
 0:05:45
Computing volume from a DEM in QGIS (Lab 8, V6)
 0:28:39
Volume Calculations using QGIS
 0:03:48
Calculation of water volume in QGIS
 0:08:10
Computing Volume From a Masked DEM using Raster Statistics in QGIS 3.10 (Lab 8 - V7)
 0:09:15
Reservoir Volume Calculation Using Raster Calculator #QGIS #RasterCalculator
 0:17:23
How to take buffer and create watershed and calculate volume of reservoir in QGIS
 0:02:58
QGIS Volume Calculation Tool - Plugin Tutorial
 0:02:27
#25 QGIS - calculate DEM Volume
 0:30:57
Calculate the Area and Volume of a Dam
 0:12:55
Estimating pond storage volumes using contours
 0:10:11
How to calculate the volume of reservoir of Dam using ArcGIS
 0:08:08
How to Calculate Volume of Water in Lake or Pond using ArcGIS Software
 0:02:57
GIS: How to perform volume calculation in QGIS? (2 Solutions!!)
 0:27:24
QGIS Calculating Volumes
 0:04:50
GIS: Cutting out depth information in raster. Calculating volume in Qgis (3 Solutions!!)
 0:08:39
How to Calculate Volume of Reservoir in ArcGIS
 0:10:00
Calculate the Catchment of a Reservoir Lake in QGIS
 0:08:03
Reservoir volume
 0:03:24
QGIS 101: Hillshade from DEM
 0:02:58
QGIS Volume Calculation Tool
 0:02:15
Global Dam Map #QGIS #GDW
Комментарии