filmov
tv
CODESYS: Visualization - Adding/removing edges to/from polygon, polyline, and Bezier curve elements

Показать описание
-------------------------------------------------------------------------------------------------------------------------------------
CODESYS: Visualization - Adding/removing edges to/from Polygon, Polyline, and Bezier curve elements
*************************************
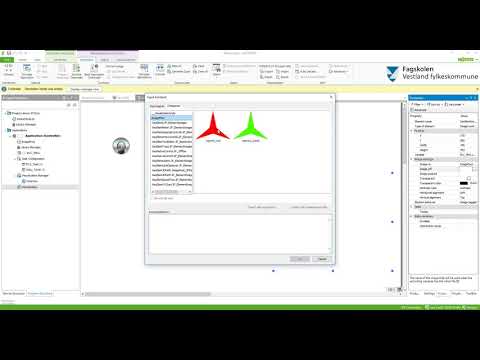
Polygon, Polyline, and Bezier curve visualization elements have a given number of edges by default. If you need more edges for any of them, there are 2 ways to follow:
1. After inserting the elements, hover your mouse on one edge, the cursor will change shape, hold the CTRL-key down, and left-click by mouse. One edge will be added for each left mouse click, as long as the CTRL key is down. Then you can move the edges and modify the shape.
2. Select the element in the visualization toolbox, and left-click in the visualization window. For each left mouse click, one edge will be added. To stop, do a right mouse click.
In order to remove one edge from any of those elements, you need to hold the CTRL and Shift keys down and do a left-mouse click. With each click, one edge will be removed.
In this way, you can create your desired visualization elements easily.
*************************************
I hope you enjoy watching the video. Please do not hesitate to like, comment, and share it. Thanks for your support.
CODESYS: Visualization - Adding/removing edges to/from Polygon, Polyline, and Bezier curve elements
*************************************
Polygon, Polyline, and Bezier curve visualization elements have a given number of edges by default. If you need more edges for any of them, there are 2 ways to follow:
1. After inserting the elements, hover your mouse on one edge, the cursor will change shape, hold the CTRL-key down, and left-click by mouse. One edge will be added for each left mouse click, as long as the CTRL key is down. Then you can move the edges and modify the shape.
2. Select the element in the visualization toolbox, and left-click in the visualization window. For each left mouse click, one edge will be added. To stop, do a right mouse click.
In order to remove one edge from any of those elements, you need to hold the CTRL and Shift keys down and do a left-mouse click. With each click, one edge will be removed.
In this way, you can create your desired visualization elements easily.
*************************************
I hope you enjoy watching the video. Please do not hesitate to like, comment, and share it. Thanks for your support.
 0:05:16
 0:03:30
 0:00:31
 0:01:24
 0:32:12
 0:06:01
 0:11:05
 0:11:46
 0:01:40
 0:02:04
 0:13:21
 0:06:17
 0:04:17
 0:08:27