filmov
tv
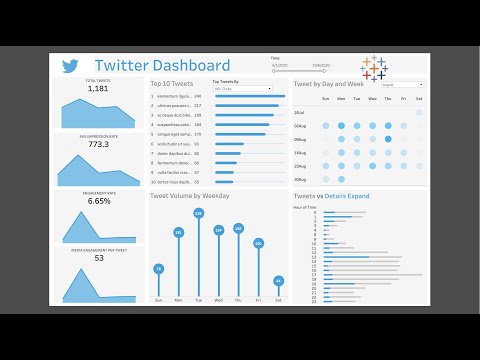
Complete Twitter Analytics Dashboard with Dash Plotly (Tabs) in Python

Показать описание
Together we will explore the twitter accounts that mention you or other handles. In this tutorial you will learn to create a twitter developer account, build a Dash app with Tabs, and understand how to connect to the twitter API to pull data into your app and plot graphs with plotly. For this app to work, make sure to install the python-twitter library,
View my book - The Book of Dash:
My GitHub Code:
Python-twitter library:
Twitter Developers account:
Best twitter accounts for animal lovers:
Video layout:
00:00 - What you will learn and code
02:33 - Part 1: Create Twitter developer account
09:09 - Part 2: Build multiple dashboard Tabs
16:50 - Part 3: The Mentions Tab
23:12 - Part 3: Twitter Raw Query
27:20 - Part 3: Build the Pandas Dataframe
32:29 - Part 3: Return the graph figures and message
36:30 - Final remarks
************************************************************************************
👉 If you appreciate these tutorials and would like to support their existence or receive 1-on-1 consultation, while getting access to my GitLab code:
*************************************************************************************
 0:37:16
Complete Twitter Analytics Dashboard with Dash Plotly (Tabs) in Python
 0:00:45
How To See Analytics On X Twitter 2024 (Step-by-Step)
 0:02:59
New Twitter Analytics Dashboard
 0:02:15
How To See Analytics on Twitter
 0:02:10
How To Check Twitter Analytics? [in 2024] (Check X Profile Analytics)
 0:30:28
Power BI Dashboard Project for Twitter for Analyzing Tweets | Design | Idea | Project
 0:42:18
Tableau Dashboard for Twitter For Analyzing Tweets
 0:12:32
Building a LIVE Twitter analytics dashboard using the Meltwater Platform
 1:09:20
Rank Math SEO Tutorial 2025 | A Step-by-Step Guide to Setup Rank Math
 0:01:49
Twitter Dashboards & Reporting for Agencies
 0:01:54
How to Use Twitter Analytics | Twitter analytics dashboard (2024)
 0:53:20
The Anatomy of a Data Analytics Dashboard with Twitter Data Analyst
 0:05:09
Build Your Own Real Time Twitter Analytics System
 0:01:05
Analytics dashboard for twitter in action.
 0:01:35
How To Check Twitter Analytics Free | How To Check Twitter Impressions Without Blue Tick | Twitter
 0:10:37
Master Twitter Analytics with Power BI in No Time!
 0:10:45
Twitter Analytics with Power BI
 0:01:39
How to link your website to your Twitter Analytics dashboard
 0:11:33
Get Twitter data into Power BI (Free PBIT)
 0:01:49
How To Check Twitter Analytics In 2024 | Check X Profile Analytics
 0:06:50
Twitter Analytics Dashboard in Power BI
 0:10:39
Demo Social Media Analytics Dashboard using PowerBI
 0:00:36
Inside Insights: Trump's tweets analytics dashboard
 0:06:42
Small X / Twitter Accounts: Do THIS and the Algorithm Will LOVE You!
Комментарии