filmov
tv
Logistic Regression in Python - Predicting if the stock market is going Up or Down

Показать описание
This video is showing how Machine Learning can be used in the stock market. It is showing how a Logistic Regression can help to predict whether the market is going Up or Down. In specific on the S&P 500.
The Logistic Regression is implement in Python using statsmodels. I have also performed this using the sklearn library so if you need any support with that kindly let me know.
Get the Notebook/Source code by becoming a Tier-2 Channel member:
I found this prediction in the book: Introduction to statistical learning with R (ISLR) as I am learning R right now. I can highly recommend this book.
This video is for educational and entertaining purposes. It is no investment advice!
If anything is unclear please drop me a comment. I am happy to help!
#Python #LogisticRegression #MachineLearning #Stockmarket
 0:19:19
Machine Learning Tutorial Python - 8: Logistic Regression (Binary Classification)
 0:10:07
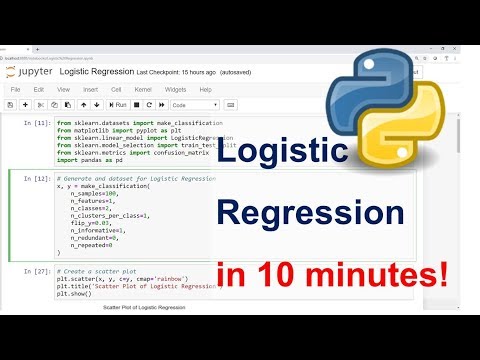
Logistic Regression in Python Step by Step in 10 minutes
 0:38:17
Logistic Regression | Logistic Regression in Python | Machine Learning Algorithms | Simplilearn
 0:14:04
How to implement Logistic Regression from scratch with Python
 0:18:39
Step by Step Tutorial on Logistic Regression in Python | sklearn |Jupyter Notebook
 0:53:41
Logistic Regression in Python | Logistic Regression Example | Machine Learning Algorithms | Edureka
 0:16:46
Hands-On Machine Learning: Logistic Regression with Python and Scikit-Learn
 0:03:48
Logistic Regression in 3 Minutes
 1:10:06
Illinois Tech Master of Data Science: Deep Dive on Linear Regression Courses 7.23.24.
 0:23:46
How To Implement Logistic Regression Using Python | Machine Learning Tutorial | Simplilearn
 0:11:46
Logistic Regression in Python from Scratch | Simply Explained
 0:17:09
Logistic Regression in Python - Machine Learning From Scratch 03 - Python Tutorial
 0:08:48
StatQuest: Logistic Regression
 0:42:40
Logistic Regression with Python | Titanic Data | Your First Kaggle Project |
 0:17:56
How to Perform Logistic Regression in Python (Step by Step)
 0:05:33
Logistic Regression Python Sklearn [FROM SCRATCH]
 0:44:21
Logistic Regression Project: Cancer Prediction with Python
 0:22:55
Logistic Regression in Python
 0:19:06
Python for Data Analysis: Logistic Regression
 0:17:55
How To Train a Good Classification Model | Logistic Regression in Python
 0:15:43
Machine Learning Tutorial Python - 8 Logistic Regression (Multiclass Classification)
 2:40:07
Logistic Regression for Classification | Working with a real-world dataset from Kaggle
 0:06:48
Machine Learning Tutorial 5 - Logistic Regression Python Implementation with Scikit-Learn
 0:08:41
How to implement Logistic Regression in Python using skLearn machine learning by Mahesh Huddar
Комментарии