filmov
tv
Algebra 2 Lesson #20 Graphing Linear Inequalities in two Variables

Показать описание
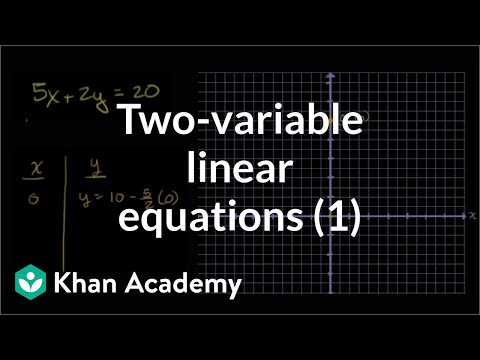
In this lesson, we will learn how to graph a linear inequality in two variables. First, we will need to graph the boundary line. This line separates the solution region from the non-solution region. From there, we need to determine which side of the boundary line to shade. This can be accomplished by solving the original inequality for y and then shading above for a greater than or a below for a less than. We could also use a test point to find the appropriate solution region.
 0:35:27
 0:05:15
 0:13:59
 0:18:25
 0:04:29
 0:13:10
 0:06:47
 0:00:15
 0:50:28
 0:07:50
 0:32:05
 0:05:57
 0:10:54
 0:03:48
 0:07:52
 0:07:32
 0:07:24
 0:05:20
 0:27:38
 0:05:00
 0:10:12
 0:00:27
 0:13:33
 0:00:48