filmov
tv
Plotting scientific graphs by hand

Показать описание
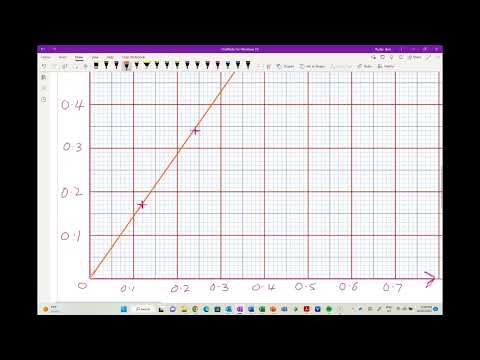
This quick example graphs sin i against sin r for light entering glass. The gradient of the line can be used to calculate the refractive index. The gradient is more accurately calculated from the graph as this gives a graphical average - anomalous points can be ignored when considering the gradient.
In physics exams the world over, marks will be awarded for:
* axes as large as possible to try and fill the paper
* scales uniform and easy to plot (small divisions must not be irrational numbers!)
* points plotted correctly
* line of best fit drawn correctly - don't join the dots! Use a ruler in this instance, or draw a smooth curve if appropriate
 0:01:00
Plotting scientific graphs by hand
 0:05:39
Graphing Data by Hand
 0:02:39
How to Draw a Graph - WORKED EXAMPLE - GCSE Physics
 0:05:12
Plotting scientific graphs in Excel (physics)
 0:08:47
Scientific method: Graphing - bar and line graphs
 0:18:57
Graphing in Science Classes
 0:05:16
Hand graphing and scatter plots
 0:10:25
How to Plot a Graph on Paper in Science
 1:23:46
Power BI Crash Course with Lucas Szupszynski
 0:04:18
5.2G graphing in Science
 0:04:59
Graphing by Hand Video 2015
 0:12:13
Scientific Graphing
 0:06:59
CH 221 Graphing Tutorial
 0:08:31
1.11 Graphing in Science (line graphs)
 0:10:11
Scientific Graphing Basics
 0:00:17
fake blood experiment #shorts
 0:16:29
Plotting a straight line graph by hand
 0:00:17
Magnetic field lines around a bar Magnet
 0:00:47
the circle dot trick
 0:00:22
Traffic signal learning for kids #papercraft #easy #ideas
 0:08:45
Graphing Scientific Data
 0:00:11
A-level Biology: line graph 101
 0:00:27
How to cheat on test using your calculator #viral #shorts
 0:00:25
Cool science model to teach your kids how the heart works #shorts
Комментарии