filmov
tv
Linear Regression Machine Learning | Linear Regression in R | Linear Regression in Python

Показать описание
This “Linear Regression” Tutorial by Great Learning would help you to comprehensively learn all the underlying concepts of Linear Regression. You will also learn how to implement linear regression in both R language and Python language
1. 1:00 - Case Study to understand Need of Regression Analysis
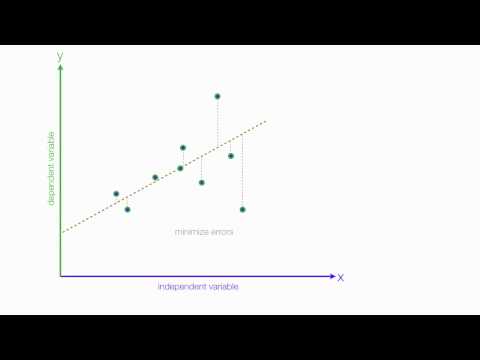
2. 4:08 - Intro to Linear Regression
3. 9:39 - Multiple Linear Regression
4. 10:50 – Linear Regression in R
5. 29:39 – Linear Regression in python
Read more on Linear Regression:
Do subscribe to our channel and click on the bell icon, to get a notification of our upcoming high quality tutorials.
If you are looking forward to pursue a post-graduation course in data analytics, then great learning offers the Business Analytics and Business Intelligence post-graduation program in collaboration with the McCombs School of Business, at the University of Texas, Austin and Great Lakes, India. The faculty pool comprises of leading academicians and industry practitioners in the field of data analytics.
PGP-Business Analytics and Business Intelligence has been ranked No.1 in India by AIM. UT Austin McCombs School of Business’ MS in Business Analytics in ranked No.2 in the world by QS World University Rankings.
Know more about Linear Regression
- Great Learning has collaborated with the University of Texas at Austin for the PG Program in Artificial Intelligence and Machine Learning and with UT Austin McCombs School of Business for the PG Program in Analytics and Business Intelligence.
🔥Check Our Free Courses with free certificate:
⚡ About Great Learning Academy:
Visit Great Learning Academy to get access to 1000+ free courses with free certificate on Data Science, Data Analytics, Digital Marketing, Artificial Intelligence, Big Data, Cloud, Management, Cybersecurity, Software Development, and many more. These are supplemented with free projects, assignments, datasets, quizzes. You can earn a certificate of completion at the end of the course for free.
⚡ About Great Learning:
With more than 5.4 Million+ learners in 170+ countries, Great Learning, a part of the BYJU'S group, is a leading global edtech company for professional and higher education offering industry-relevant programs in the blended, classroom, and purely online modes across technology, data and business domains. These programs are developed in collaboration with the top institutions like Stanford Executive Education, MIT Professional Education, The University of Texas at Austin, NUS, IIT Madras, IIT Bombay & more.
SOCIAL MEDIA LINKS:
🔹 For more updates on courses and tips follow us on:
 0:02:34
Linear Regression in 2 minutes
 0:03:59
Why Linear regression for Machine Learning?
 0:35:46
Linear Regression Analysis | Linear Regression in Python | Machine Learning Algorithms | Simplilearn
 0:27:27
Linear Regression, Clearly Explained!!!
 0:05:30
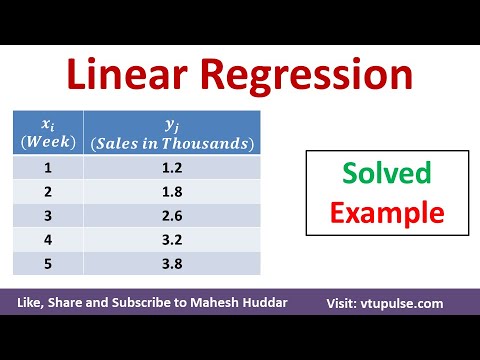
Linear Regression Algorithm – Solved Numerical Example in Machine Learning by Mahesh Huddar
 0:17:46
Machine Learning in Python: Building a Linear Regression Model
 0:15:14
Machine Learning Tutorial Python - 2: Linear Regression Single Variable
 0:04:29
Linear Regression in Machine Learning Explained in 5 Minutes
 1:21:11
Deep Learning with PyTorch (Study Group) | Classification (Logistic Regression) | Part 7
 0:11:01
Lec-4: Linear Regression📈 with Real life examples & Calculations | Easiest Explanation
 0:24:15
Tutorial 26- Linear Regression Indepth Maths Intuition- Data Science
 0:28:36
Linear Regression Algorithm | Linear Regression in Python | Machine Learning Algorithm | Edureka
 0:24:38
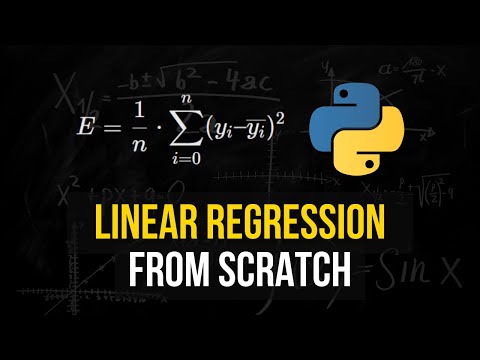
Linear Regression From Scratch in Python (Mathematical)
 0:14:20
Linear Regression Explained in Hindi ll Machine Learning Course
 0:17:03
How to implement Linear Regression from scratch with Python
 0:13:29
Video 1: Introduction to Simple Linear Regression
 3:52:06
Linear Regression Algorithm | Linear Regression Machine Learning | Linear Regression Full Course
 0:50:52
Linear Regression in Python - Full Project for Beginners
 0:20:27
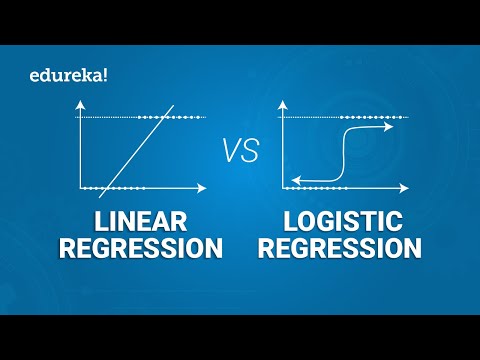
Linear Regression vs Logistic Regression | Data Science Training | Edureka
 0:20:11
When To Use Regression|Linear Regression Analysis|Machine Learning Algorithms
 3:53:53
Machine Learning for Everybody – Full Course
 0:15:05
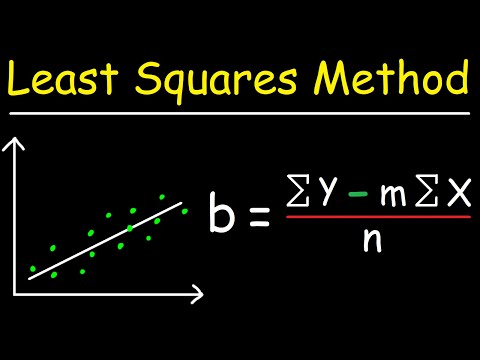
Linear Regression Using Least Squares Method - Line of Best Fit Equation
 0:16:36
Interview Prep Day 2- Linear Regression Interview Question-The Most Important Algorithm In ML & ...
 0:05:18
An Introduction to Linear Regression Analysis
Комментарии