filmov
tv
Profiling JEE/Spring applications with JProfiler

Показать описание
This screencast showcases JProfiler's support for JEE and Spring, in particular the JEE/Spring component detection and the JEE/Spring aggregation level in the call tree and hot spot views.
 0:06:54
Profiling JEE/Spring applications with JProfiler
 0:05:39
Profiling HTTP calls and tracking them between JVMs
 0:05:38
How to configure a script probe in JProfiler
 0:06:33
Profiling Java applications in a Kubernetes cluster
 0:50:11
Advanced visualization approaches for profiling Java apps
 0:05:02
Offline profiling and triggers in JProfiler (HD)
 0:12:18
Profiling Java Application
 0:05:09
Methods statistics and exceptional method runs in JProfiler (HD)
 0:06:28
Profiling Java applications in Docker containers
 0:01:05
JProfiler in One Minute: Profiling Java Applications with Precision!
 0:04:10
Request tracking in JProfiler (HD)
 0:06:45
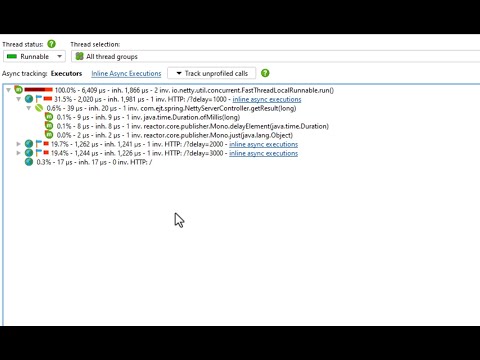
Profiling a Netty server
 0:03:55
Finding a memory leak with JProfiler (old)
 0:05:43
Working with merged reference trees in JProfiler
 0:05:42
JProfiler's integration into IntelliJ IDEA
 0:06:09
Garbage collector analysis in JProfiler
 0:30:01
How to analyze Java performance problems in Eclipse using a profiler?
 0:04:42
How to Launch VisualVM in STS Eclipse | Java Profiler & Performance Tool Tutorial
 0:59:24
SE430 Class 8 8 2021 JProfiler demo + Testing tools
 0:12:44
Apresentação da ferramenta jprofiler
 1:47:19
PerfUG #007 Trouver les problematiques de performance avec JProfiler
 0:27:34
29 - 4 Spring Boot Packaging, Profiling and Deployment
 0:05:49
Boosting Performance? How to fix Java memory leaks and run your code smoothly
 0:50:17
Performance Testing Java Applications by Pratik Patel
Комментарии