filmov
tv
Multi-objective Optimization with Genetic Algorithm - A MATLAB Tutorial for Beginners

Показать описание
In this tutorial, I show implementation of a multi-objective optimization problem and optimize it using the built-in Genetic Algorithm in MATLAB. The given objective function is a simple function that helps a beginner user to understand the basic concept of optimization in MATLAB easier. The given objective function or fitness function has one input variable and two outputs. I write two separate functions one for the fitness function and one for the main algorithm. I plot the pareto-front that illustrates the obtained solutions in a proper way.
For a simpler tutorial on optimization using Genetic Algorithm with single objective functions without constraints see this video:
For a simpler tutorial on optimization using Genetic Algorithm with single objective functions with constraints see this video:
For a simpler tutorial on optimization using Genetic Algorithm with single objective functions without constraints see this video:
For a simpler tutorial on optimization using Genetic Algorithm with single objective functions with constraints see this video:
 0:20:36
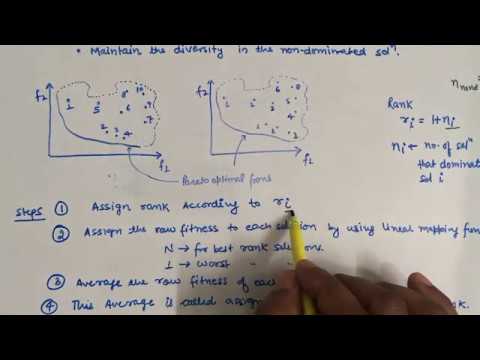
NSGA-II Optimization: Understand fast how it works [complete explanation]
 0:17:04
Multi-objecitive Genetic Algorithm (MOGA)
 0:05:49
Multiobjective optimization
 0:00:53
Optimization Calculation with Multi-Objective Genetic Algorithm
 0:14:31
Multi-Objective Optimisation - Writing your own Genetic Algorithm Part 6
 0:01:23
Multi objective optimization using genetic algorithm
 0:02:10
A course on multi-objective optimization
 0:07:01
How to Use Multi-Objective Genetic Algorithm Solver in Matlab
 0:04:23
Some Useful Notes on Multi-Objective Optimization
 0:00:41
Multi-objective Optimization Algorithm
 0:07:54
Multi-Objectives Optimization using Genetic Algorithm in Optimization Toolbox in MATLAB
 0:01:51
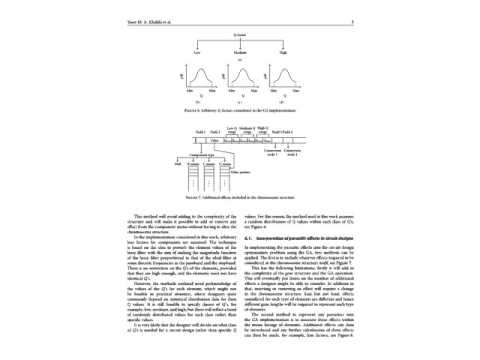
Multiobjective Optimization Tool for a Free Structure Analog Circuits Design Using Genetic Algorithm
 0:07:28
Multi-objective Optimization with Genetic Algorithm - A MATLAB Tutorial for Beginners
 0:20:50
Genetic Algorithm-based Multi-objective Optimal Power Flow for Improving Power System Performance
 0:00:47
multiobjective genetic algorithm
 0:20:17
Multi-Objective Optimisation Implementation - Writing your own Genetic Algorithm Part 7
 0:07:33
Optimizing ZDT2 (n=30) multi-objective problem using Genetic Algorithm - A MATLAB tutorial
 1:01:22
Multi-Objective Optimization using R and Matlab (Optimization methods for CE)
 1:01:15
Better Machine Learning Models with Multi Objective Optimization
 0:19:51
Multi-Objective Convergence - Writing your own Genetic Algorithm Part 8
 0:42:14
A Multi-Objective Genetic Algorithm to Find... - Elva Maria Novoa del Toro - ISCBacademy Webinar
 0:30:45
Multi-objective optimization - Introduction
 0:07:28
Multi-Objective Optimization: Easy explanation what it is and why you should use it!
 3:26:05
Multiobjective Optimization Using Metaheuristics (Lecture-1)
Комментарии