filmov
tv
SAS Visual Analytics. GEO Map.
Показать описание
В данном видео Вы можете познакомиться с тем как загружать данные в Lasr Server, а также Как отображать географическую аналитику в SAS Visual Analytics.
Николай Тимаков
SAS
SAS Visual Analytics
Рекомендации по теме
0:13:15
SAS Tutorial | Getting Started with Mapping in SAS Visual Analytics
0:03:54
Geography Graphs - Using Data for Geographic Mapping and Forecasting in SAS Visual Analytics
0:08:51
SAS Visual Analytics. GEO Map.
0:13:40
Explore and Visualize Data with SAS Visual Analytics | SAS Viya Quick Start Tutorial
0:02:23
SAS Tutorial | Create Layered Maps
0:00:43
VA 8.2 - Geomap Icons using display rules
0:00:15
VA 8.2 - Geomap Custom Shapes
0:03:19
Creating a GeoMap Report
0:34:06
Analyzing GPS Data from a Sailrace Using SAS Visual Analytics
0:03:58
SAS Demo | Viewing Reports With the High Contrast Theme in SAS Visual Analytics
0:09:07
SAS Demo | How to filter data in SAS Visual Analytics report based on user location
0:57:57
SAS Accessibility Webinar | Creating Accessible Maps Using SAS Graphics Accelerator and Google Maps
1:32:49
SAS Tutorial | Data Visualization with SAS Visual Analytics in SAS Viya
0:28:02
Spatial Analytics With SAS: Examining Contributions to OpenStreetMap for the Covid-19 Response
0:10:31
Geographic Data, SAS Viya Jobs, Data-Driven Content, and REST APIs!
0:20:56
Raising the Bar! Developing World-Class Reports with SAS Visual Analytics
0:00:42
Treemaps Demo - Data Visualization and Visual Analytics
0:55:44
SAS Accessibility Webinar | Exploring Accessible Campus Maps Using SAS Graphics Accelerator
0:09:28
Creating Box Plot & Geo Map using Report Builder | Practice Session #4 | SAS VA Training
0:07:16
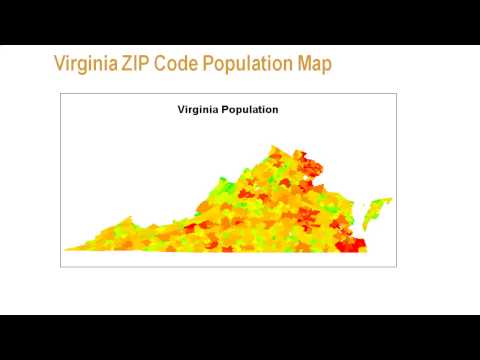
Creating ZIP Code-Level Maps with SAS
0:00:45
SAS Visual Analytics
0:07:35
SAS Tutorial | Tips for Filtering Data Sources in SAS Visual Analytics
1:35:20
SAS Tutorial | Visual Analytics for SAS Viya
0:06:34
SAS Visual Analytics Statistic Clusters

 0:13:15
 0:03:54
 0:08:51
 0:13:40
 0:02:23
 0:00:43
 0:00:15
 0:03:19
 0:34:06
 0:03:58
 0:09:07
 0:57:57
 1:32:49
 0:28:02
 0:10:31
 0:20:56
 0:00:42
 0:55:44
 0:09:28
 0:07:16
 0:00:45
 0:07:35
 1:35:20
 0:06:34