filmov
tv
How to Trade Volume: Tutorial

Показать описание
We quickly want to show you the basics of adding volume to your chart. Especially what that means and how it can be used. At its core volume shows you how many buyers and sellers transacted at a specific price. It shows you how many shares, contracts or coins were traded over a specific period of time.
Some traders use volume to confirm trends, measure popularity, and look for abnormal trading activity.
Volume is different from Volume Profiles in the sense that Volume shows you how much trading Volume occurred at a specific point in time. Volume Profiles show how much trading Volume occurred at a specific price. We explain this later on in the video toward the end.
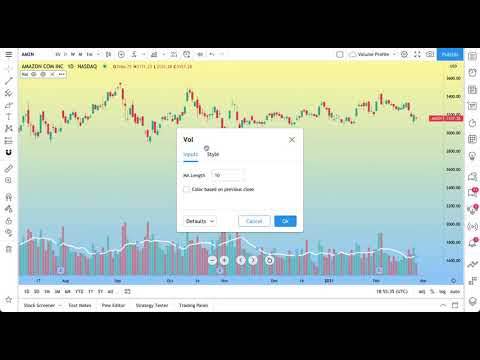
Adding volume to your chart is easy. Open the Indicators menu and then search for Volume. From there, you can edit Volume to show you a moving average and change its color or appearance.
Some traders use volume to confirm trends, measure popularity, and look for abnormal trading activity.
Volume is different from Volume Profiles in the sense that Volume shows you how much trading Volume occurred at a specific point in time. Volume Profiles show how much trading Volume occurred at a specific price. We explain this later on in the video toward the end.
Adding volume to your chart is easy. Open the Indicators menu and then search for Volume. From there, you can edit Volume to show you a moving average and change its color or appearance.
 0:12:39
How to Trade Volume: Tutorial
 0:10:42
🛑 STOP Trading Until You Learn VOLUME ANALYSIS...
 0:00:30
Why You NEED To Be Using Volume When Trading
 0:07:00
How to Trade Volume (Forex)
 0:08:13
Secret Volume Trading Strategy VRPR | How To Trade Volume Profile
 0:56:23
The RIGHT WAY to use Volume on Candlestick Charts (with ZERO experience)
 0:00:56
The Secret To Using The Volume Profile Indicator #shorts
 0:08:05
BEST Volume Strategy for Daytrading Stocks (Volume Trading Explained)
 0:02:52
Every Trader Strategy 3 #trading #stockmarket #video
 0:56:24
3 Steps to Master Volume Trading - The Complete Beginner's Guide
 0:13:37
Understanding the Basics of Volume Price Analysis
 0:00:38
How to use FIXED RANGE VOLUME PROFILE (1 Minute Tutorial)
 0:27:06
Trading won’t work if you don’t know THIS Volume Analysis Indicator
 0:00:43
How To Use Volume Imbalances (VI) As A Trader - ICT Concepts
 0:00:58
You’ve Been Reading Volume WRONG #daytrading #optionstrading #stocks #shorts
 0:01:01
Buy or Sell? Volume Trading Strategy #trading #forex #volumetrading
 0:14:21
You've Been Reading Volume WRONG (Mind Blowing Video)
 0:00:38
🤢 Volume Profile + Smart Money Price Action Structure Trading Strategy
 0:00:20
ONLY Trading Indicator You Need | Volume Profile 💸
 0:00:47
This Volume Trick Will BLOW YOUR MIND #trading #stockmarket #stocks #daytrading #shorts
 0:10:49
Crypto Trading Masterclass 09 - How To Trade Cryptocurrency Using The Volume Indicator
 0:01:01
Buy or Sell? Volume Trading Strategy #trading #forex #crypto #SOLANA
 0:00:59
Volume is the Best Trading Indicator
 0:00:55
Types of Volume
Комментарии