filmov
tv
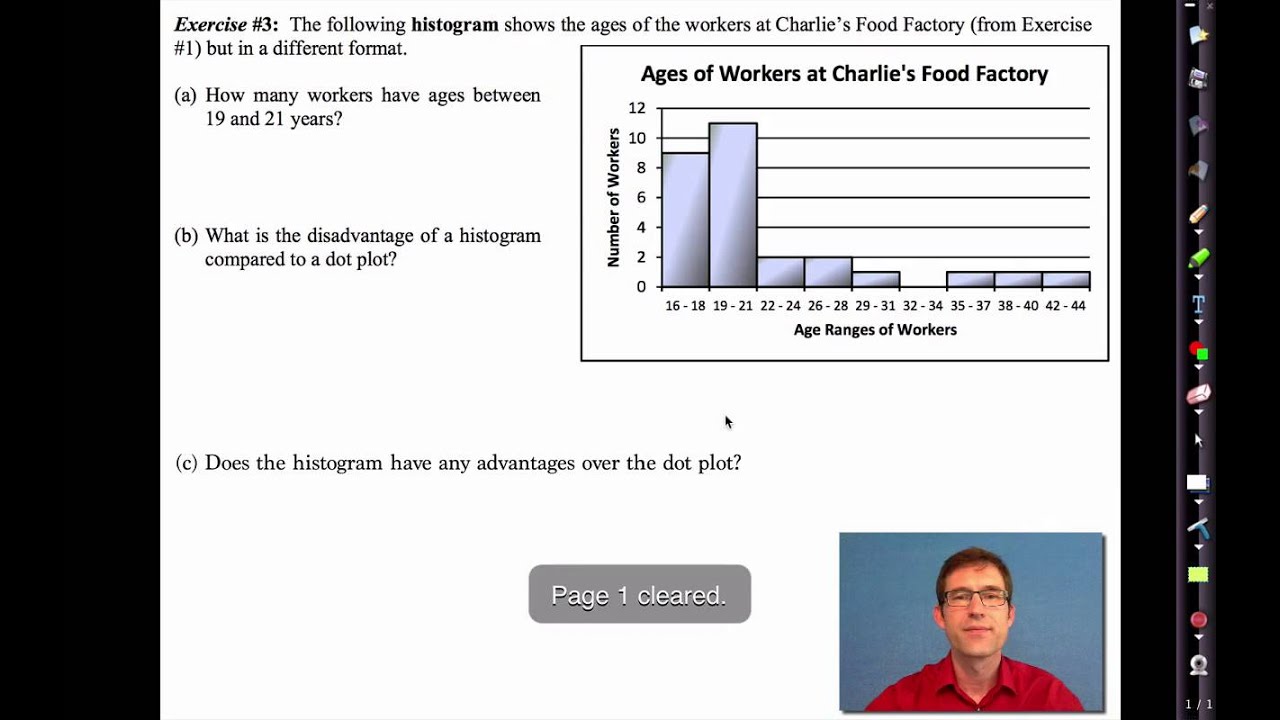
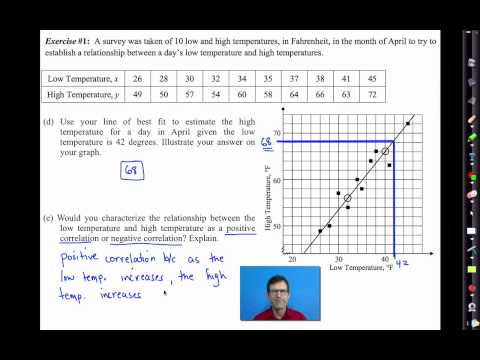
Common Core Algebra I.Unit #10.Lesson #1.Graphical Displays of Data
Показать описание
In this lesson, students review the basic methods of dot plots and histograms to show the distribution of a data set. For a copy of the worksheet used in this video, click on:
 0:32:06
 0:32:58
 0:26:23
 0:21:06
 0:32:58
 0:21:12
 0:19:41
 0:26:36
 0:06:57
 0:21:06
 0:28:54
 0:33:28
 0:21:12
 0:22:43
 0:11:05
 0:19:41
 0:23:08
 0:36:56
 0:05:00
 0:23:19
 0:33:28
 0:29:07
 0:27:14
 0:28:12