filmov
tv
How To Filter Out RSI Indicator Fake Signals
Показать описание
✅ Please like, subscribe & comment if you enjoyed - it helps a lot!
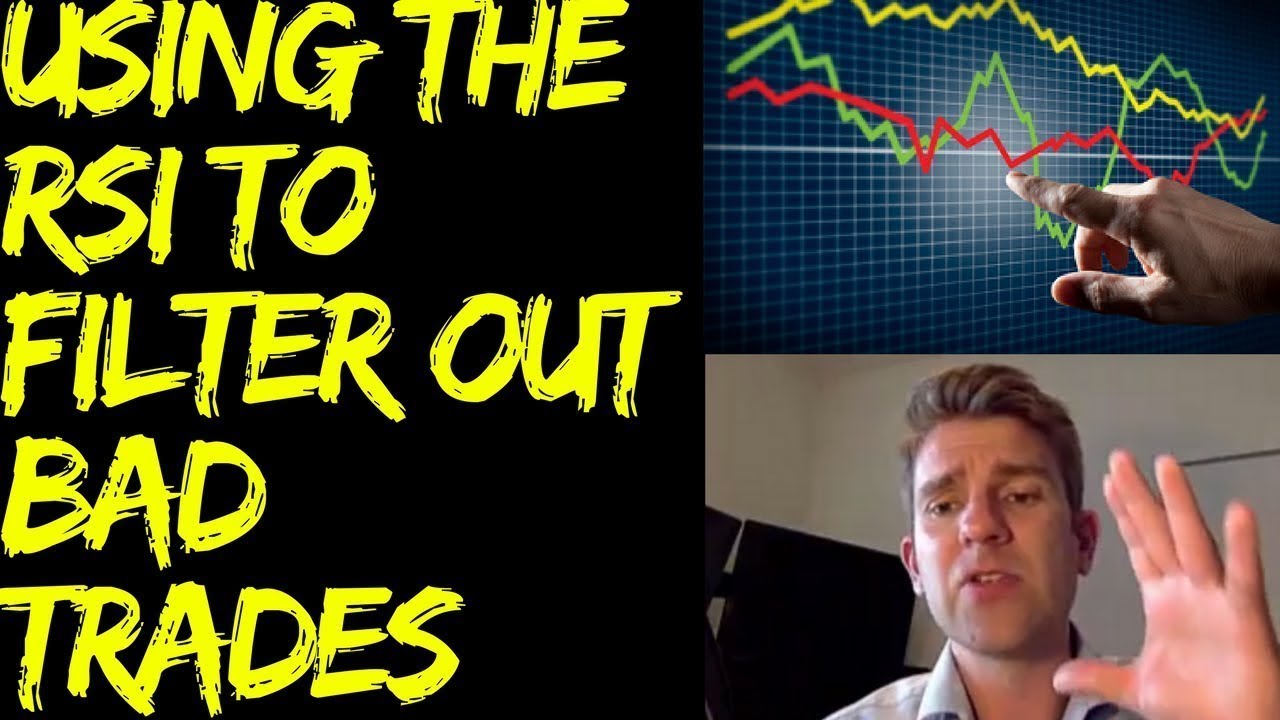
This time we look at using the RSI indicator as a filter. This is the Relative Strength Index which gives some indication of the strength of a financial security relative to itself. It’s in the family of indicators that are called oscillators and usually mapped out below the price chart with a range that goes from 0 to 100%. Other oscillators such as the stochastic could be used instead.
The idea of an oscillator is that its value usually goes between 30% and 70%, or sometimes 25% to 75%, and when it goes outside these bounds it indicates that the stock is overbought or oversold. Having said that, in a trend you may find that the oscillator stays outside these bounds while the trend continues, so in itself being outside the normal range is not a reason to enter a long or short trade.
But the way we are using the oscillator this time is as a filter, and that is to make us hesitate before going into a trade where the elements are not all aligned. It’s to keep from getting involved in a chart where everything isn’t in our favour. So regardless of how much we may think we want to take a long trade, if the oscillator is above say 70% it would not be a good time to do so.
Similarly, although we wouldn’t necessarily use the RSI as a trigger for a trade to happen, we can take a low value of RSI as allowing us to place a trade. If the trend is a strong uptrend, it’s unlikely that the value will come down as far as 25%, but we can at least look for the value to be down to say 45% before we contemplate taking a long trade. Depending on our trading plan, if it goes lower on a retracement in what is otherwise a strong uptrend we may decide we definitely want to become involved.
Using a filter to decide when not to trade will almost inevitably mean that you are making fewer trades. Some of those trades you may look back on as missed opportunities, particularly if they work out as you thought they might. But what we want to concentrate on is increasing the probability of good trades, and that means eliminating suspect trades, those that may tend to work out less often than others. By using the various filters explained here, you should keep down the number of bad trades that you suffer.
Related Videos
The Stochastic Indicator: When it Works, When it Doesn't & Why - Part 1 📈
Stochastics Trading Strategy Part 2 📈
How to Profit from using the RSI (Relative Strength Index)? Part 1 📈
RSI Indicator Trading Strategy Part 2 📈
How To Filter Out RSI Indicator Fake Signals
Multi Time Frame Analysis With Oscillators
 0:08:57
How To Filter Out RSI Indicator Fake Signals
 0:08:57
Using the RSI [Relative Strength Index] to Filter Out Bad Trades
 0:07:22
This Indicator Filters Out 99% Of False Signals - Williams Alligator
 0:00:56
Why You Are Using The RSI WRONG
 0:38:34
RSI Divergence Strategy| Filter out False Divergences using these 3 Tools|Part I
 0:12:58
RSI Divergence Trading Strategy
 0:08:02
HOW TO USE RSI TO FILTER OUT LOSING TRADES (KENYAN FOREX TRADER)
 0:01:00
Why You Are Using The RSI Indicator WRONG #shorts
 0:11:11
How a Time-of-Day Filter can improve an RSI Trading Strategy
 0:06:41
Bollinger Band + RSI Trading Strategy That Actually Works
 0:13:57
RSI Trading Strategy: You Are Using It WRONG! | RSI Indicator Divergence Trading Strategy
 0:03:52
FOLLOW the MOMENTUM - DON'T make my mistakes
 0:11:16
How To Avoid Consolidating Markets (My Secret)
 0:00:51
RSI Divergence Explained: The Secret Trading Strategy You Need to Know
 0:11:07
NEW Magic RSI Chat GPT strategy: New premium indicator became free : Work all market all times
 0:16:04
Best Divergence Trading Strategy explained - complete tutorial
 0:14:30
Filter BEST Trades Using ADX Indicator Combined with RSI
 0:30:21
The only 'RSI' video you will ever need | RSI Indicator | RSI Strategy | RSI Trading
 0:14:05
StockPro | SECRETS TRICKS OF RSI TO FILTER POWERFUL STOCKS
 0:10:34
BEST STOCHASTIC Trading Strategy? Better Than RSI! Use This Day Trading Stochastic for HUGE Profits
 0:32:33
RSI as a Trade Filter
 0:00:57
How RSI Makes Trading Look Like Magic - Unveiling the Power of Momentum Indicators!
 0:44:00
Best RSI Indicator Trading Strategy - Wysetrade Method
 0:32:07
RSI scanner | Make your own scanner using chartink
Комментарии