filmov
tv
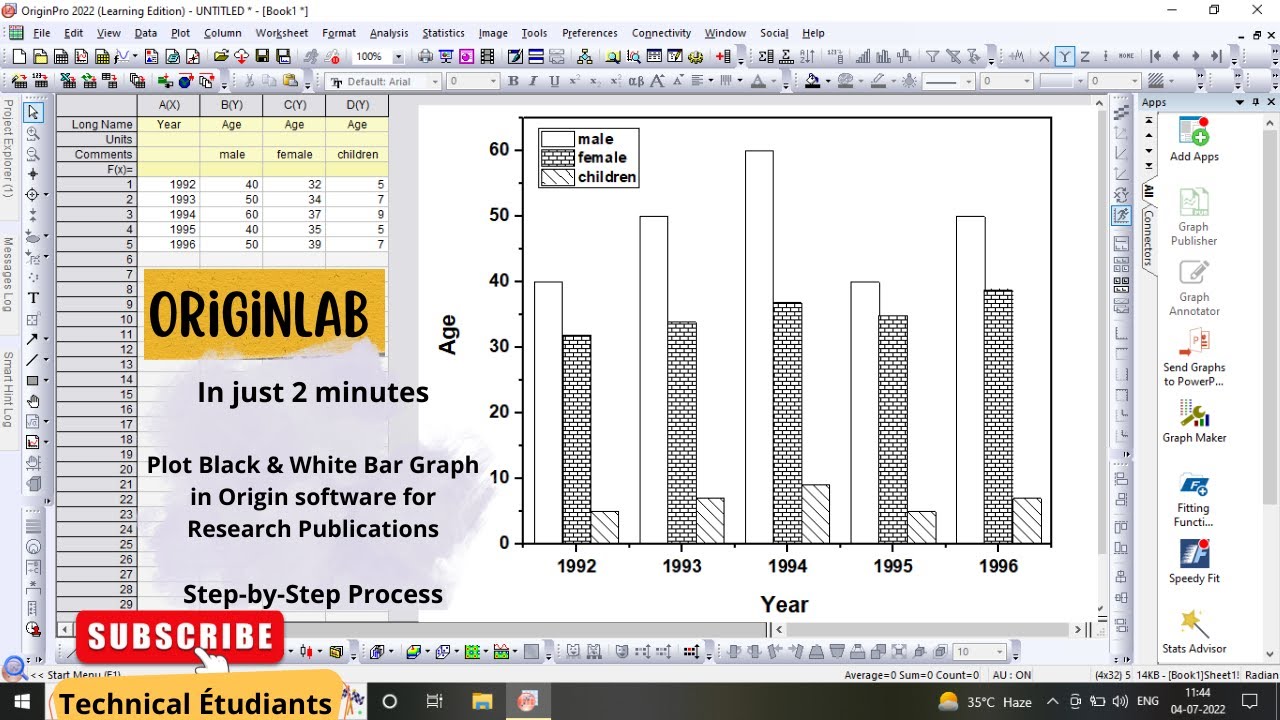
How to plot Color/Black & White Bar Graph in Origin Software for Journal publications II # Tutorial
Показать описание
Dear friends,
In this tutorial, you will learn, how to plot a color / Black & White BAR Graph in Origin 2022 Software.
This video is about drawing graph/plot/diagram in Origin Pro software in Black & white color.
To draw a very good quality and magnified graphs Origin Pro is one of the best software. The software is highly recommended for drawing high resolutions diagrams for publications in journal papers. The plots/graphs obtained in Origin software are far better than Excel graphs or others.
The research related content considering block diagram, graphs, paper format, writing Journal papers, Tables, references format, submission in journals, reply to reviewers comments, software use for simulation and obtaining results, Preparing research proposal for PhD . All the related contents are covered in this channel.
So, stay tuned for such videos ......
Previous Video Link for Reference:-
* How to search components, vary data rate and other internal parameters and take sweep iterations in optisystem software.
*How to write a MATLAB Code for plotting different kinds of Stacked & Grouped Bar Graph II #Tutorial
*How to Plot a Line Graph for 10 raise to power (10^-9) or BER values using MATLAB Code II #Tutorial
* How to Plot a Line Graph for single and multiple y-axis parameters using MATLAB Code II #Tutorial
*Shortcut tricks of MATLAB software II Implement Artificial Neural Network (ANN) II MATLAB Tutorial
* Simulation of Li-Fi / VLC based FSO system using Optisystem Software II In Hindi II
* Design & Simulation of Inter-Satellite Communication Link using Optisystem Software II In Hindi II
* Design & Simulate QAM-8,16,32 & 64 using Optisystem Software II Constellation Diagram II In Hindi II
* For Research Paper submission in SCI Journals
* How to book train tickets online from mobile phone.
For any queries related to Optisystem Software, MATLAB, Originlab, Implementation of Machine Learning using MATLAB in optical domain, research related project work, journal publication or manuscript submission in SCI, Scopus Indexed journals and IEEE conferences you can contact us on
Also, follow us on Instagram for finding the latest updates related to research and technical contents
▬▬▬▬▬▬▬▬▬▬▬▬▬▬▬▬▬▬▬▬▬▬▬▬▬
Also Like, Share & Subscribe our Technical Étudiants Channel
▬▬▬▬▬▬▬▬▬▬▬▬▬▬▬▬▬▬▬▬▬▬▬▬▬
Also Subscribe my 2nd YouTube Channel
Étudiants Kitchen (for healthy & tasty cooking recipes)
👋 About this channel: Hi, I am Aanchal Sharma and I am here to help you with all kind of research related queries whether it be related to software usage, writing synopsis or proposals, research paper writing and publication.
#Origin tutorial
# plotting BAR Graph in Origin Pro
#Plot Black& white Bar Graph in Origin 2022
#How to plot Color BAR graph in Origin
# BAR graphs
#Simple Black & white BAR Graph
#Origin Software Tutorial
#BAR Graph in Origin
#Origin
#Plotting BAR Graph in Origin for single values
#Plotting Line Graph in Origin for multiple values
#Basics of Origin software
#Origin Software tutorial
#How to improve the Quality of plots in Origin
#How to copy figure or plots in Origin software directly to your manuscript
#How to plot bar graph directly without importing data set in origin
# How to import large data set to plot graph in Origin software
#How to change the axes or the figure properties of a Origin Bar Graph Plot
#How to define color codes & style in Origin for Black & white BAR Graphs
#How to change axes font and size in Origin software
#How to plot simple BAR Graphs in Origin
#Shortcut tricks to plot BAR graphs in Origin
#Create all kinds of BAR Graph in Origin
#Simplest tricks to for plotting BAR Graph in Origin
#Origin Software
#Origin Pro Tutorial for BAR Graphs
#Origin tutorial
#official_edulearning
#Technical Étudiants
![[Fix] Black and](https://i.ytimg.com/vi/RayEjnh7o5k/hqdefault.jpg) 0:04:08
0:04:08
 0:01:52
 0:02:03
 0:12:33
 0:00:15
 0:01:40
 0:05:31
 0:05:43
 0:02:55
 0:00:43
 0:02:00
 0:08:00
 0:06:51
 0:01:44
 0:05:27
 0:00:25
 0:01:04
 0:02:16
 0:02:45
 0:00:58
 0:06:43
 0:00:25
 0:00:29
 0:01:43