filmov
tv
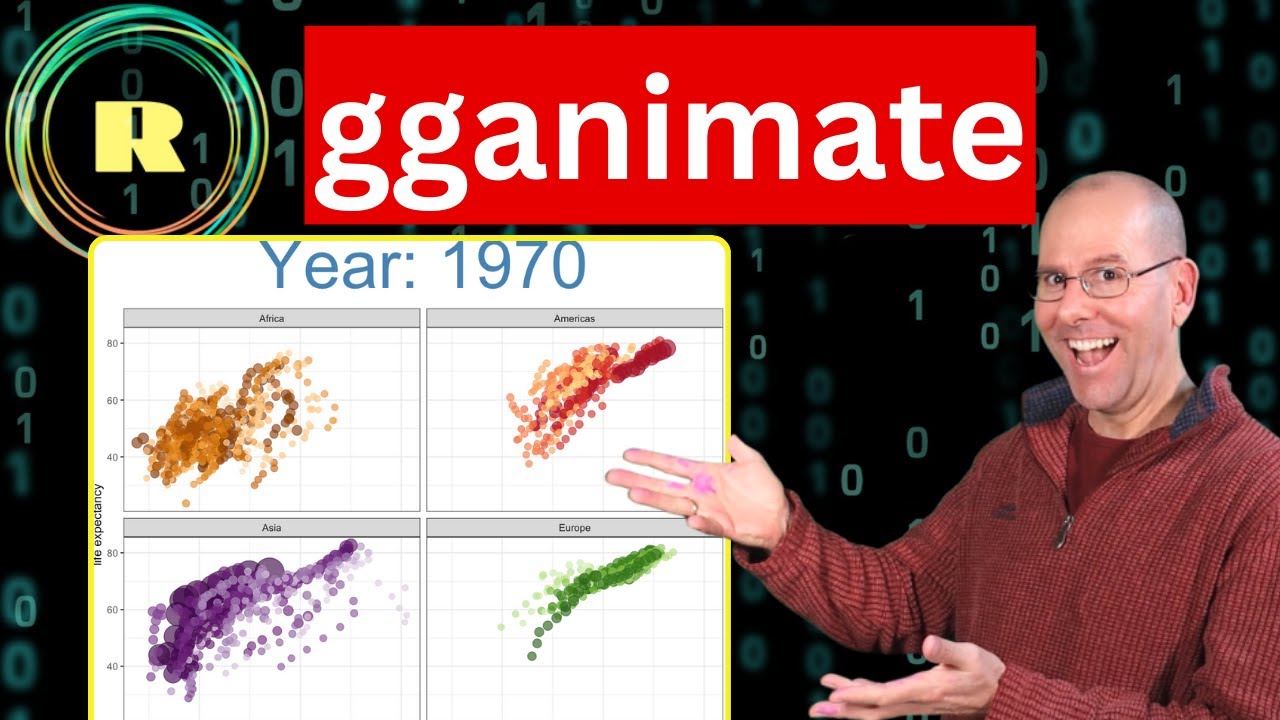
Animations in R with gganimate
Показать описание
Create plots that are animated using ggplot2 and the gganimate packages in R. If you're learning data visualization using R programming then you'll love this tutorial. In this video Greg Martin will walk you through the code to create colourful plots and graphs that move and change. These can be scatterplots bar charts, histograms, line graphs and more. It works particularly well when looking at time-series data. This video is short and to the point and uses data that is built into R studio for all of the examples.
 0:06:40
Animations in R with gganimate
 0:05:16
R language tip: Animations in R
 0:06:37
Animating ggplots in R with gganimate
 0:13:54
Animate Graphs in R: Make Gorgeous Animated Plots with gganimate
 0:01:01
animated plot in R using gganimate
 0:21:54
Animate two synchronized figures in R with gganimate, magick, and ggplot2 (CC100)
 0:13:19
How to create an animated line graph in R using gganimate! (Best tutorial)
 0:11:32
GGPlot - Animations
 0:00:46
Animation Covid19 in Vietnam by gganimate (Grammar of Animated Graphics ) framework in R
 0:07:22
Animated plot in R using gganimate, ggplot2 and gapminder package
 0:11:34
ggplot2 - How to Create Animated Plots in R Language
 0:49:16
Juneteenth 2021: Creating a data based movie in R with gganimate of lynchings (CC118)
 1:33:46
gganimate R Package: Animating ggplot2's Grammar of Graphics R by Mitchell O'Hara-Wild | W...
 0:21:54
Data Science Live - Animation with R plots
 0:09:49
Animated Data Visualizations with {gganimate} for Science Communication during the Pandemic
 0:07:01
Spatial data animation with ggmap and gganimate
 0:22:11
Animation of scatter and line plots: ggplot enhanced by gganimate
 0:19:03
Thomas Lin Pedersen | gganimate live cookbook | RStudio (2019)
 0:14:05
Animating the Datasaurus Dozen Dataset in R
 0:06:09
Advance topic presentation - gganimate (R package)
 0:32:51
PLOTCON 2016: David Robinson, gganimate: Animation within the grammar of graphics
 0:44:39
Interactive exploration of data—animating ggplot with gganimate and gifski
 0:24:29
Creating animated plots in R with gganimate
 0:08:50
An introduction to the {gganimate} package
Комментарии