filmov
tv
Access Apache log files. Apache log files location centros? Apache log file analyzer? apache log %d

Показать описание
Here's how to Access Apache log files.
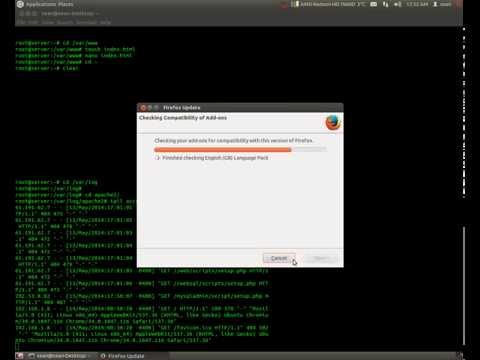
i. In CentOS, the Apache web server log files are typically located in the `/var/log/httpd/` directory. There are two main types of log files associated with Apache:
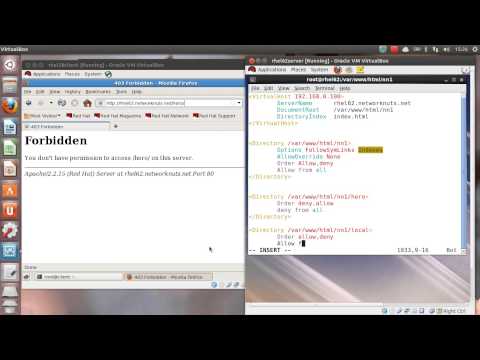
1. **Access Log**: The access log records all requests made to the server, including details such as the IP address of the client, the date and time of the request, the requested URL, the HTTP status code, and more. The access log file is usually named `access_log`, and you can find it in the `/var/log/httpd/` directory.
Example:
```
/var/log/httpd/access_log
```
2. **Error Log**: The error log contains information about any errors or issues encountered by the Apache server. This includes error messages, warnings, and other relevant details. The error log file is typically named `error_log`, and you can find it in the same `/var/log/httpd/` directory.
Example:
```
/var/log/httpd/error_log
```
You can view these log files using a text editor, or you can use commands such as `cat` or `tail` in the terminal to inspect the contents. Additionally, you may need root or sudo privileges to access these log files.
ii. There are several log file analyzers available for Apache log files that can help you extract meaningful insights and statistics from the raw log data. Here are a few popular Apache log file analyzers:
1. **AWStats**:
- AWStats is a free and open-source log file analyzer that can analyze Apache, Nginx, and other web server logs.
- It provides detailed statistics, including information about visitors, pages, hits, bandwidth, and more.
- AWStats generates HTML reports that are easy to read and navigate.
2. **Webalizer**:
- Webalizer is another widely used log file analyzer for Apache logs.
- It generates detailed, visually appealing reports with graphs and charts.
- Webalizer provides information about visitor activity, top URLs, referrers, and more.
3. **GoAccess**:
- GoAccess is a real-time web log analyzer that can analyze Apache and Nginx log files on the fly.
- It provides an interactive, terminal-based dashboard with live updates.
- GoAccess supports various log formats and can generate both text and HTML reports.
4. **Logwatch**:
- Logwatch is a customizable log analysis system that can monitor and analyze Apache log files.
- It summarizes log data and sends reports via email or displays them on the console.
- Logwatch is more general-purpose and can analyze logs from various services.
5. **Analog**:
- Analog is a simple yet powerful log file analyzer that supports Apache logs.
- It generates text-based reports with useful statistics and summaries.
- Analog is known for its speed and efficiency in processing log files.
Before using any log file analyzer, make sure to review the documentation and installation instructions provided by the respective tools. Additionally, ensure that you have the necessary permissions to access and analyze the Apache log files on your server.
iii. In Apache HTTP Server, the `%d` log format specifier is used to represent the time taken to serve the request in microseconds. The `%d` format specifier outputs the duration of the request processing, measured in microseconds.
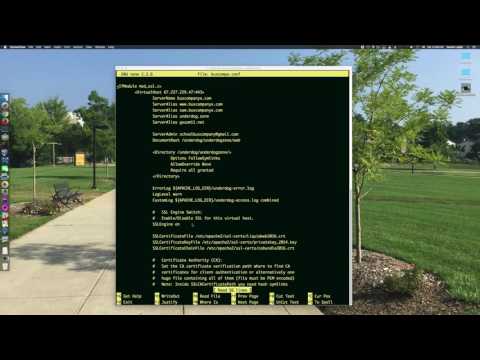
Here is an example of a log format configuration in the Apache configuration file using the `%d` specifier:
```apache
LogFormat "%h %l %u %t \"%r\" %angled-bracket-heres %b \"%{Referer}i\" \"%{User-Agent}i\" %D" custom_format
CustomLog logs/access_log custom_format
```
In this example, `%D` is used to represent the time taken to serve the request in microseconds. This information is included in the log entry for each request.
When a request is processed, the corresponding log entry will include the time taken in microseconds. This can be useful for performance analysis and understanding how much time the server spends handling each request.
i. In CentOS, the Apache web server log files are typically located in the `/var/log/httpd/` directory. There are two main types of log files associated with Apache:
1. **Access Log**: The access log records all requests made to the server, including details such as the IP address of the client, the date and time of the request, the requested URL, the HTTP status code, and more. The access log file is usually named `access_log`, and you can find it in the `/var/log/httpd/` directory.
Example:
```
/var/log/httpd/access_log
```
2. **Error Log**: The error log contains information about any errors or issues encountered by the Apache server. This includes error messages, warnings, and other relevant details. The error log file is typically named `error_log`, and you can find it in the same `/var/log/httpd/` directory.
Example:
```
/var/log/httpd/error_log
```
You can view these log files using a text editor, or you can use commands such as `cat` or `tail` in the terminal to inspect the contents. Additionally, you may need root or sudo privileges to access these log files.
ii. There are several log file analyzers available for Apache log files that can help you extract meaningful insights and statistics from the raw log data. Here are a few popular Apache log file analyzers:
1. **AWStats**:
- AWStats is a free and open-source log file analyzer that can analyze Apache, Nginx, and other web server logs.
- It provides detailed statistics, including information about visitors, pages, hits, bandwidth, and more.
- AWStats generates HTML reports that are easy to read and navigate.
2. **Webalizer**:
- Webalizer is another widely used log file analyzer for Apache logs.
- It generates detailed, visually appealing reports with graphs and charts.
- Webalizer provides information about visitor activity, top URLs, referrers, and more.
3. **GoAccess**:
- GoAccess is a real-time web log analyzer that can analyze Apache and Nginx log files on the fly.
- It provides an interactive, terminal-based dashboard with live updates.
- GoAccess supports various log formats and can generate both text and HTML reports.
4. **Logwatch**:
- Logwatch is a customizable log analysis system that can monitor and analyze Apache log files.
- It summarizes log data and sends reports via email or displays them on the console.
- Logwatch is more general-purpose and can analyze logs from various services.
5. **Analog**:
- Analog is a simple yet powerful log file analyzer that supports Apache logs.
- It generates text-based reports with useful statistics and summaries.
- Analog is known for its speed and efficiency in processing log files.
Before using any log file analyzer, make sure to review the documentation and installation instructions provided by the respective tools. Additionally, ensure that you have the necessary permissions to access and analyze the Apache log files on your server.
iii. In Apache HTTP Server, the `%d` log format specifier is used to represent the time taken to serve the request in microseconds. The `%d` format specifier outputs the duration of the request processing, measured in microseconds.
Here is an example of a log format configuration in the Apache configuration file using the `%d` specifier:
```apache
LogFormat "%h %l %u %t \"%r\" %angled-bracket-heres %b \"%{Referer}i\" \"%{User-Agent}i\" %D" custom_format
CustomLog logs/access_log custom_format
```
In this example, `%D` is used to represent the time taken to serve the request in microseconds. This information is included in the log entry for each request.
When a request is processed, the corresponding log entry will include the time taken in microseconds. This can be useful for performance analysis and understanding how much time the server spends handling each request.
 0:07:19
 0:09:48
 0:01:05
 0:01:43
 0:43:34
 0:03:11
 0:05:48
 0:09:16
 0:16:35
 0:06:46
 0:04:59
 0:02:52
 0:05:05
 0:02:27
 0:04:25
 0:04:01
 0:09:42
 0:21:29
 0:01:22
 0:15:31
 0:43:46
 0:16:56
 0:02:31
 0:02:24