filmov
tv
Noam Elfanbaum - Let’s Build a Python Profiler in 25 LOC

Показать описание
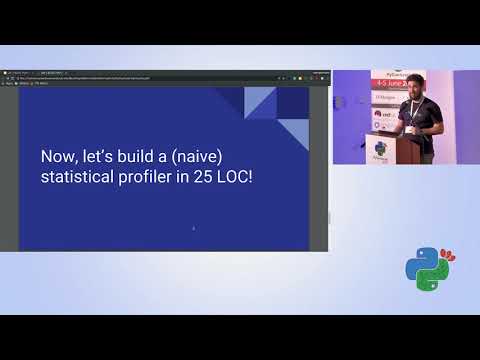
Let’s Build a Python Profiler in 25 LOC
[EuroPython 2018 - Talk - 2018-07-25 - Lammermuir]
[Edinburgh, UK]
By Noam Elfanbaum
A profile is a set of statistics that describes how often and for how long various parts of the program executed. Most profilers run inside your Python process. If you’re inside a Python program you generally have pretty easy access to its stack, hence we can gather information about time spent in each level.
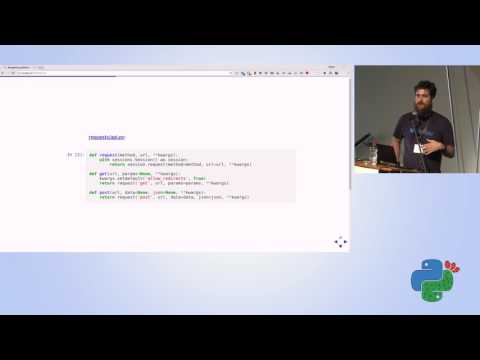
In this talk we'll build a Python profiler from scratch and so learn about the dynamic nature of Python and how do well-known profilers such as cProfile.
We'll also learn the difference between a tracing and a sampling profiler and which one to use in what circumstance.
[EuroPython 2018 - Talk - 2018-07-25 - Lammermuir]
[Edinburgh, UK]
By Noam Elfanbaum
A profile is a set of statistics that describes how often and for how long various parts of the program executed. Most profilers run inside your Python process. If you’re inside a Python program you generally have pretty easy access to its stack, hence we can gather information about time spent in each level.
In this talk we'll build a Python profiler from scratch and so learn about the dynamic nature of Python and how do well-known profilers such as cProfile.
We'll also learn the difference between a tracing and a sampling profiler and which one to use in what circumstance.
 0:27:03
 0:21:56
 0:25:56
 0:26:44
 0:31:04
 0:23:53
 0:00:38
 1:12:05
 0:30:53
 0:22:03
 0:28:51
 3:24:38
 0:23:02
 0:26:26
 0:19:19
 0:46:10
 0:23:31
 0:23:42
 0:26:39
 0:30:10
 0:27:09
 0:28:33
 0:27:06
 0:33:18