filmov
tv
Hypothesis Testing – Module 8 – Quantitative Methods – CFA® Level I 2025

Показать описание
2025 Prep Packages for the CFA® Program exam offered by FinQuiz Pro (notes, summaries, question bank, mock exams, and formula sheet):
Understanding Statistical Inference and Hypothesis Testing
All right, folks, let's dive into the world of statistical inference and hypothesis testing. It might sound a bit dry at first, but trust me, it's fascinating stuff once you get the hang of it. Let's get started with the concept of statistical inference.
What is Statistical Inference?
Statistical inference is about making judgments about a larger group or population based on a smaller sample. Think of it as trying to understand a whole pizza just by looking at a slice. One key part of this process is hypothesis testing.
Hypothesis Testing Basics
A hypothesis is essentially a statement about one or more populations. For instance, we might hypothesize that the average return on a certain investment is 5%. Hypothesis testing helps us objectively determine whether the sample data supports this hypothesis.
In the finance world, making informed decisions is crucial. Whether you're an analyst, investor, or financial adviser, you need to base your decisions on solid evidence. Hypothesis testing provides a structured way to make these decisions by assessing whether your assumptions (hypotheses) about the financial world hold true based on sample data.
Key Concepts in Hypothesis Testing
Hypothesis testing involves two main activities: hypothesis testing and estimation. Hypothesis testing is where we make statements about a population using a sample, while estimation is about guessing the value of population parameters based on sample data. We can make point estimates or interval estimates.
Steps in Hypothesis Testing
1. State the Hypothesis:
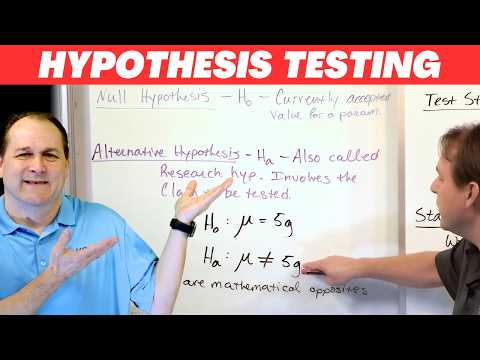
- Formulate the null hypothesis (H0) and the alternative hypothesis (H1).
- The null hypothesis is the default assumption (e.g., the average return on a stock is 5%).
- The alternative hypothesis is what we suspect might be true instead (e.g., the average return on a stock is not 5%).
2. Choose the Test Statistic:
- The test statistic is a value calculated from our sample data, helping us determine whether to reject the null hypothesis.
- Common test statistics include the Z statistic (used when the population variance is known) and the T statistic (used when the population variance is unknown and the sample size is small).
3. Decide on the Significance Level:
- The significance level, often denoted by alpha (α), is the probability of rejecting the null hypothesis when it is actually true (Type I error).
- Common choices are 5% or 1%.
4. Set the Decision Rule:
- This involves identifying the critical region and critical values. If the calculated test statistic falls into this region, we reject the null hypothesis.
5. Gather and Analyze Sample Data:
- Calculate the test statistic using sample data, ensuring the data is free from errors and biases.
6. Make a Decision:
- Compare the calculated test statistic to the critical values to determine whether to reject the null hypothesis.
7. Make an Economic or Investment Decision:
- Consider whether the results are statistically significant and economically meaningful for decision-making.
Types of Errors in Hypothesis Testing
1. Type I Error (α): Rejecting the null hypothesis when it is true (false positive).
2. Type II Error (β): Failing to reject the null hypothesis when it is false (false negative).
Testing Differences Between Means
1. Independent Samples:
- Used when comparing the means of two distinct populations. The T test is commonly used, with hypotheses structured based on whether the means are equal or not.
2. Dependent Samples:
- Used for related groups, such as before and after measurements on the same subjects. The paired sample T test is utilized.
Testing Variances
- Single Variance: Tested using the chi-square statistic.
- Comparing Two Variances: Utilizes the F statistic.
Parametric vs. Nonparametric Tests
1. Parametric Tests: Focus on population parameters (mean, variance) and require specific assumptions about the population distribution (e.g., T tests, Z tests).
2. Nonparametric Tests: Do not focus on parameters and make minimal assumptions about the population distribution (e.g., Wilcoxon signed-rank test, Mann-Whitney U test).
Conclusion
Hypothesis testing is a fundamental tool in finance, helping us make informed decisions based on sample data. Understanding the steps, types of errors, and differences between parametric and nonparametric tests is crucial for making sound investment decisions. Happy studying, and good luck with your CFA exam preparation!
 0:25:26
 0:21:41
 0:05:03
 0:30:00
 0:13:34
 0:31:31
 0:47:41
 0:53:56
 0:07:21
 0:40:20
 0:40:17
 0:12:45
 0:18:56
 0:18:33
 0:19:32
 0:19:33
 0:11:27
 0:23:06
 0:31:35
 0:23:41
 1:22:20
 0:12:49
 0:02:52
 0:04:22