filmov
tv
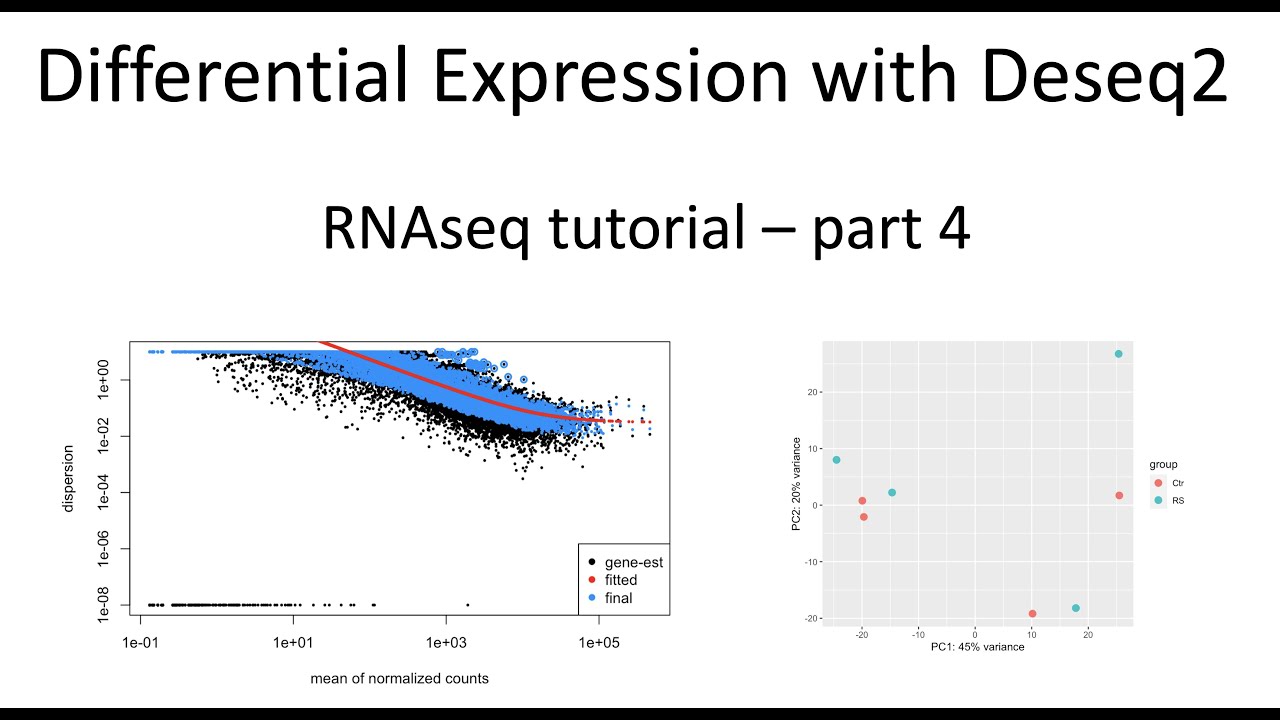
RNAseq tutorial – part 4 – Differential expression analysis with Deseq2
Показать описание
Here I use Deseq2 to perform differential gene expression analysis. I used a count table as input and I output a table of significantly differentially expressed genes. I also show PCA and dispersion QC of the RNAseq data.
The output data can be further manipulated and explored in R, python, or excel. E.g., you can extract positively enriched genes and sort by log-fold change. You can also use the Ensemble identifiers in gene ontology analysis directly. However, in future videos I will show the conversion of Ensemble IDs to gene symbol and show how to create heatmaps and other useful figures.
The samples include normal human cell control and replicative senescence cells from NCBI accession GSE171663
Deseq2 citation:
Love MI, Huber W, Anders S. Moderated estimation of fold change and dispersion for RNA-seq data with DESeq2. Genome Biol. 2014;15(12):550. doi: 10.1186/s13059-014-0550-8. PMID: 25516281; PMCID: PMC4302049.
 0:16:23
RNAseq tutorial – part 4 – Differential expression analysis with Deseq2
 0:42:11
Beginner's RNA-Seq Tutorial Part 4 - Dr. Pedro Miura's BIOL792 Course, University of Nevad...
 0:26:20
Bulk RNA-Seq Analysis Demystified: Step-by-Step Tutorial Part 4 rRNA removal by #SortMeRNA
 0:08:08
RNAseq Process Part 4
 0:01:43
BioJupies Tutorial Part 4 of 8 - Analyzing GEO Data
 0:49:04
Bioinformatic Analysis of Single Cell Data - Part 4
 0:01:43
BioJupies Tutorial Part 4 of 8 - Analyzing GEO Data
 0:32:57
Anna Cuomo & Ximena Ibarra - Single-cell tutorial [4/6]: Single cell RNA seq data analysis QC...
 0:04:46
RNAseq tutorial - part 1 - building STAR genome index
 0:33:26
What is RNA - seq? || Part 4 || Data Analysis
 2:23:52
GL4U: RNAseq Bootcamp June 2021 Pilot Day4 Part 4 of 4
 0:02:33
RNAseq tutorial - part 3 - generating count table
 0:00:50
Part 4 #rnaseqdata: Upstream Analysis to identify Master Regulatory Molecule #Nocodingbioinformatics
 0:02:59
RNA-Seq Data Analysis Tutorial (04) - Filtering
 0:00:49
RNAseq Differential Gene Expression: Volcano Plot
 1:01:11
Molecular insight into Gene Expression Using Digital RNAseq: Digital RNAseq Webinar Part 3
 0:20:59
4 part 4: Viral biosynthesis and latency
 0:00:46
How to perform RNA seq data analysis in Excel? #exceltutorial #transcriptomics
 0:28:34
RNA-seq tutorial with DESeq2: Differential gene expression project
 0:07:24
IIHG Intro to the UCSC Genome Browser | Part 4 of 5
 0:00:53
Hands on RNA-Seq Analysis With Galaxy
 0:14:52
Introducing a tool to get valuable RNA-seq insights in hours
 0:46:05
RNA Sequencing: Part III - Introduction to Analysis
 0:57:35
How to analyze RNA-Seq data? Find differentially expressed genes in your research.
Комментарии