filmov
tv
MATLAB Data Visualization Basics Part 1

Показать описание
00:00 Overview
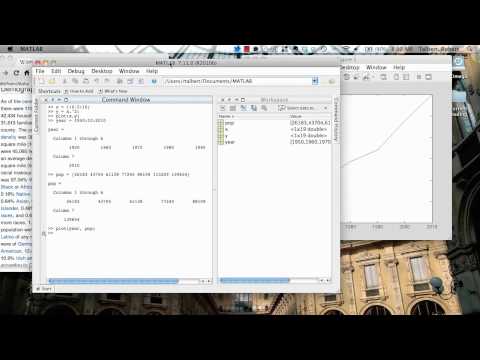
00:29 plot() function
01:21 close all plots
03:11 Input data for plotting
05:27 Create new figure
06:05 Plot data
06: 39 hold on to add additional plots
07:08 Plot with formatting (line type, color, markers ...)
12:02 Using help to find plotting option
15:09 Formatting markers
17:59 Add title
18:22 Add legend
19:29 Special text format (subscript)
20:23 Change legend location
22:45 Add x-axis label and y-axis label
23:22 Axis limits
24:22 Adding text to figure
26:31 hold off when done with the figure
26:50 Exercise 1 Plot function basics
35:55 Using greek letters and special symbols
 0:37:13
 0:13:50
 0:03:26
 0:06:11
 0:04:13
 0:18:15
 0:03:00
 0:31:57
 0:01:42
 0:02:20
 0:10:54
 0:03:56
 0:15:36
 0:10:44
 0:06:11
 0:09:10
 0:15:02
 0:54:53
 0:08:40
 1:57:45
 0:02:50
 0:46:11
 0:00:16
 0:22:12