filmov
tv
The Paired-Difference t Procedure

Показать описание
I discuss an example of the paired-difference t procedure, working through a confidence interval and hypothesis test and interpreting the results. (Paired-difference procedures are sometimes referred to as matched-pairs procedures, depending on the setting.)
The identical twin-schizophrenia data in this video is from:
Suddath, R., Christison, G., Torrey, E., Casanova, M., and Weinberger, D. (1990). Anatomical abnormalities in the brains of monozygotic twins discordant for schizophrenia. New England Journal of Medicine, 322:789--794. Values used in this video are simulated values based on the summary statistics found in the paper.
 0:08:21
The Paired-Difference t Procedure
 0:08:34
An Introduction to Paired-Difference Procedures
 0:12:56
Matched or Paired Samples T-Test - Hypothesis Testing
 0:07:17
One sample t-test vs Independent t-test vs Paired t-test
 0:11:17
T-Tests: A Matched Pair Made in Heaven: Crash Course Statistics #27
 0:12:06
An Example of a Paired-Difference t Test and Confidence Interval
 0:07:10
Paired Samples T-Test (How to calculate and interpret)
 0:05:21
Paired Differences
 0:02:55
Statistical Tests 7: Paired Data
 0:08:58
t-tests and p values
 0:07:50
06 Paired Samples t-Tests in SPSS – SPSS for Beginners
 0:10:30
Paired difference in means (1 of 2)
 0:23:56
Hypothesis testing: Paired Differences
 0:13:01
Stats 11.1 t-test for a paired difference in sample means for dependent samples
 0:01:41
P-value, Paired Difference Test
 0:04:08
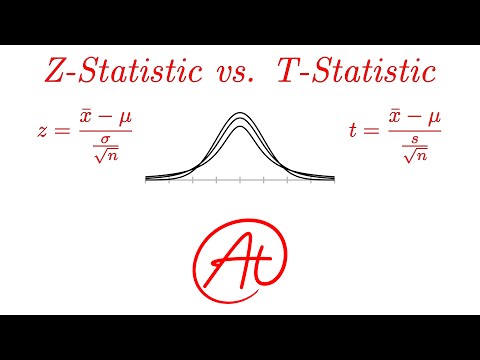
Z-Statistics vs. T-Statistics EXPLAINED in 4 Minutes
 0:09:23
Top Statistician Reveals Best Dependent Samples t test Techniques | Paired t test
 0:11:10
How to calculate t statistics test between the means of related groups (dependent means)
 0:11:15
Intuitive Statistics: Paired Samples T-test
 0:10:11
Student's t-test
 0:00:13
Ho Vs H1 (Hypothesis Testing Rules 2022) #Shorts (Must Watch Playlists)@AsadInternationalAcademy
 0:00:15
The use process of female menstrual cups #shorts
 0:01:01
How to perform Paired T test in excel without needing formula #excel #shorts
 0:06:56
Two-sample t test for difference of means | AP Statistics | Khan Academy
Комментарии