filmov
tv
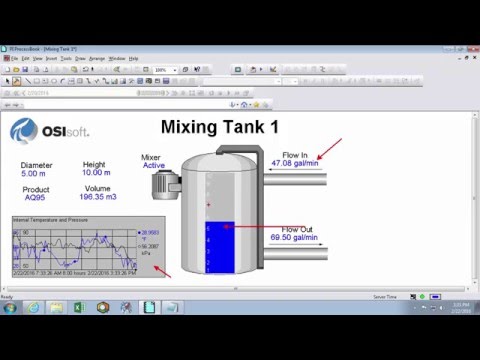
OSIsoft: The xy plot in PI ProcessBook. v3.0

Показать описание
An XY Plot (or "scatter plot") is available to compare variables against one another.
Video content is copyright of OSIsoft, LLC - 2011. All rights reserved. Any redistribution or reproduction of part or all of the contents in any form is prohibited other than for your personal and non-commercial use.
Video content is copyright of OSIsoft, LLC - 2011. All rights reserved. Any redistribution or reproduction of part or all of the contents in any form is prohibited other than for your personal and non-commercial use.
 0:04:49
OSIsoft: The xy plot in PI ProcessBook. v3.0
 0:08:21
OSIsoft: Build an XYPlot v3.2
 0:04:15
OSIsoft: XY Plot. v3.0
 0:07:18
OSIsoft: Describe and configure the PI XYPlot WebPart. v2.2
 0:02:40
PI Vision: Beyond the Basics - XY Plot with Reference Curve
 0:02:29
OSIsoft: Multi Cross Directional Plots in ProfileView. v2.21
 0:07:01
OSIsoft: Plot a Basic Profile in ProflieView. v2.21
 0:10:15
OSIsoft: Build a Trend v3.2
 0:01:11
OSIsoft: Meet the Author of the Building Advanced Displays in PI ProcessBook II Online Course
 0:48:23
PI 101: A Live Demonstration of OSIsoft’s PI System
 0:16:46
OSIsoft PI SDKs Getting Started - Part 4, Getting Plot Values
 0:07:36
OSIsoft: Configure Basic Plot Options in ProfileView. v2.21
![[Webinar]: PI 101:](https://i.ytimg.com/vi/0kDo48_lxl8/hqdefault.jpg) 1:01:41
1:01:41
[Webinar]: PI 101: A Live Demonstration of the OSIsoft PI System
 0:01:37
OSIsoft: Vertical axis scale in PI ProcessBook. v3.0
 0:17:21
OSIsoft: Build a New Display in PI ProcessBook with Static and Dynamic Symbols [v3.5]
 0:04:45
OSIsoft: Drawing shapes in PI ProcessBook. v3.0
 0:02:58
OSIsoft: The layout tab when building a trend. v3.0
 0:03:14
OSIsoft: Change workbook entry levels in Book or Outline mode v3.2
 0:04:13
OSIsoft: ODBC datasets in PI ProcessBook. v3.0
 0:01:24
Scatterplot Matrix Coresight
 0:01:04
OSIsoft: Zoom in on a trend in PI ProcessBook. v3.0
 0:08:12
OSIsoft: Use the Data Favorites docking window to drag and drop items to create elements v3.2
 0:01:45
OSIsoft: Viewing options on multiple items. v3.0
 0:03:14
OSIsoft: Add a linear regression trace to a trend v3.2
Комментарии