filmov
tv
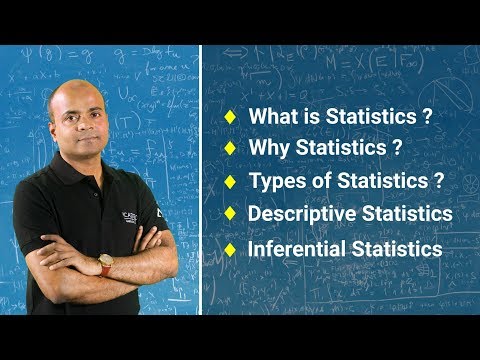
Introduction to Statistics - Organization and Presentation of Data

Показать описание
In this video, dive into the essentials of data organization and presentation in statistics! We’ll break down key concepts such as data types, frequency, range, statistical tables, and graphs—everything you need to grasp the basics of how data is structured and presented.
Whether you're a student, a professional, or someone curious about data, this video offers clear and concise explanations to help you master these fundamental statistical tools.
🔍 What You’ll Learn:
Data: Different types of data and how to organize them.
Frequency & Range: Understanding distribution and spread.
Statistical Tables: How to construct and interpret tables.
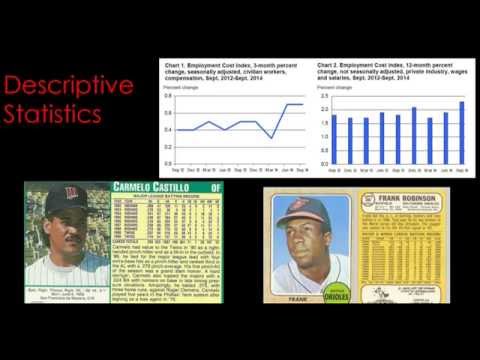
Graphs: Visualizing data with histograms, pie charts, and bar graphs.
🔗 Connect With Us:
#dataorganization
#datapresentation
#statistics
#GraphsAndCharts
#learnstatistics
#frequencydistribution
Whether you're a student, a professional, or someone curious about data, this video offers clear and concise explanations to help you master these fundamental statistical tools.
🔍 What You’ll Learn:
Data: Different types of data and how to organize them.
Frequency & Range: Understanding distribution and spread.
Statistical Tables: How to construct and interpret tables.
Graphs: Visualizing data with histograms, pie charts, and bar graphs.
🔗 Connect With Us:
#dataorganization
#datapresentation
#statistics
#GraphsAndCharts
#learnstatistics
#frequencydistribution
 0:56:46
 0:42:09
 0:03:21
 1:18:03
 0:01:56
 0:08:15
 8:15:04
 0:10:27
 0:03:19
 0:22:17
 0:49:30
 0:34:25
 0:27:51
 0:00:54
 0:13:32
 0:06:28
 0:04:28
 0:14:34
 0:09:06
 1:19:12
 0:10:26
 1:00:01
 1:01:14
 0:34:24