filmov
tv
Dr Emlyn Clay - Analyzing the ElectroCardioGram (ECG)

Показать описание
Filmed at PyData London 2017
Description
The ElectroCardioGram (ECG) is the electrical activity of your heart. By recording it, classifying fiducial markers and analysing these features we can make assessments about the healthy state of the heart, diagnose certain diseases of the heart and predict whether a subject will go on to develop certain diseases. Python and the scientific stack provide all the tools you need.
Abstract
The ElectroCardioGram (ECG) is a periodic waveform that describes the action of heart as it moves through 3 electromechanical phases:
Depolarization and contraction of the atria
Depolarization and contraction of the ventricles
Repolarization of the ventricles and atria
It is an enormous area of study and the ECG is tractable and effective way of detecting healthy sinus rythmn, diagnosing arrthymia and potentially predicting the decline of the heart from a healthy state to a disease state.
Python and the scientific stack offers everything a researcher or a hobbyist would need to conduct sophisticated analysis and in this talk we'll describe how to store and load the ECG, process the signal, classify fiducial markers and make interpretations about the state of the heart.
PyData is an educational program of NumFOCUS, a 501(c)3 non-profit organization in the United States. PyData provides a forum for the international community of users and developers of data analysis tools to share ideas and learn from each other. The global PyData network promotes discussion of best practices, new approaches, and emerging technologies for data management, processing, analytics, and visualization. PyData communities approach data science using many languages, including (but not limited to) Python, Julia, and R.
We aim to be an accessible, community-driven conference, with novice to advanced level presentations. PyData tutorials and talks bring attendees the latest project features along with cutting-edge use cases. 00:00 Welcome!
00:10 Help us add time stamps or captions to this video! See the description for details.
 0:45:39
Dr Emlyn Clay - Analyzing the ElectroCardioGram (ECG)
 0:29:11
Emlyn Clay - Protein folding and what it means for drug discovery | PyData London 2024
 0:31:38
Emlyn Clay - Phython, Pharmaceuticals & Discovery
 0:08:01
Machine Learning | Diagnosis of Acute Coronary Syndrome | ECG
 0:54:56
Don’t Miss a Beat: Arrhythmia Detection for Preclinical ECG Research
 0:02:46
A22 Using deep networks for scientific discovery in physiological signals
 0:55:22
ECG signal analysis and interpretation part 1
 0:14:39
Reduced Lead Setting for Diagnostic ECG Interpretation Using Deep Learning Models
 0:28:30
ECG signal analysis and interpretation part 2
 0:00:32
AI-Powered ECG Analysis
 1:53:17
Acquisition and Processing of Biomedical Signals and images using Machine Learning
 1:13:36
IEEE CIS Webinar: Convolutional Networks for Medical Image Analysis Its Past, Future, and Issues
 0:00:11
Python Continuous Wavelet applied to ECG
 0:06:58
Machine Learning | Detection of Myocardial Infarction | Pulse Plethysmograph | PPG
 0:33:33
Why AI in the Medical Field Both Sucks and Rocks... - Kicky van Leeuwen
 0:02:51
AI analysis of MJM detects SBx in OSA patients - Video abstract [ID 320664]
 0:24:09
Data Acquisition Lecture
 0:02:33
Deep learning for ECG signal analysis: Prediction of Myocardial Infarction ahead of time
 0:01:11
ECG Magic
 0:02:10
Data Science Capstone - Student Interview - Rice D2K Lab
 0:07:33
How to use deep learning for ECG signal analysis
 0:52:09
Improving Regulatory Submissions Through Enhanced ECG Interval and Arrhythmia Assessment
 0:00:29
iqinsider - Facial Expression Tracking & Contactless Heart Rate Estimation DEMO
 0:35:34
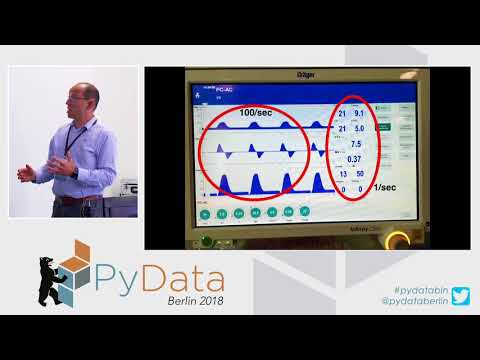
Python in Medicine: analysing data from mechanical... - Gusztav Belteki
Комментарии