filmov
tv
How to Create Dynamic Heat Map with or without numbers in Excel - Office 365
Показать описание
A heat map is a visual interpretation of numeric data where different values are represented by different colors. In Excel a heat map is used to display individual cells in different color codes based on their values. Heat map can be created by using conditional formatting color scale. This video explains the how to create following heat maps
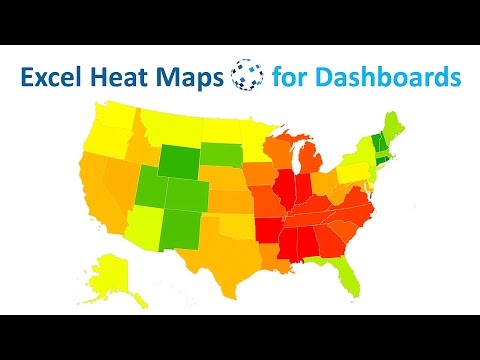
1. Create a temperature heat map of a certain region
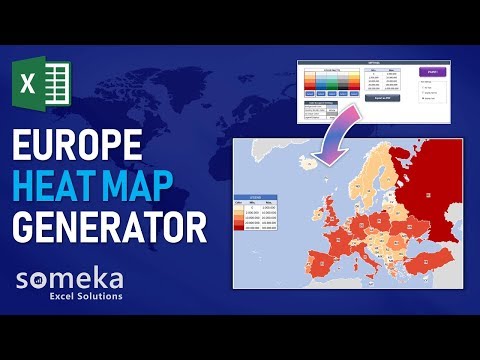
2. Create a heat map using custom color scale
3. Create a heat map without numbers
4. Create a heat map with square cells
5. Create a dynamic heat map using a checkbox
6. Create a dynamic heat map without numbers
7. Create a heat map with radio button control to either display or not
To download the practice Excel file please click on the link below
To learn more about conditional formatting of cells in Excel please click on the link below
1. Create a temperature heat map of a certain region
2. Create a heat map using custom color scale
3. Create a heat map without numbers
4. Create a heat map with square cells
5. Create a dynamic heat map using a checkbox
6. Create a dynamic heat map without numbers
7. Create a heat map with radio button control to either display or not
To download the practice Excel file please click on the link below
To learn more about conditional formatting of cells in Excel please click on the link below
 0:00:17
 0:17:34
 0:05:13
 0:06:55
 0:12:20
 0:06:06
 0:15:36
 0:05:46
 0:08:07
 0:07:39
 0:00:24
 0:07:04
 0:03:10
 0:02:59
 0:06:05
 0:03:32
 0:05:16
 0:05:04
 0:18:04
 0:11:23
 0:03:50
 0:00:55
 0:09:24
 0:05:48