filmov
tv
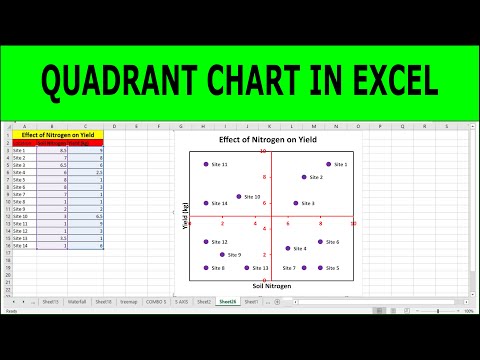
How to make quadrant chart in excel | 4 quadrant chart in excel

Показать описание
#Innovativeexcel #acorporatelearning #ishwarchandgahalout
Hi Friends,
This Video, we will discuss how to create quadrant chart in excel and what are the benefits of this.
below are some benefits of quadrant chart:
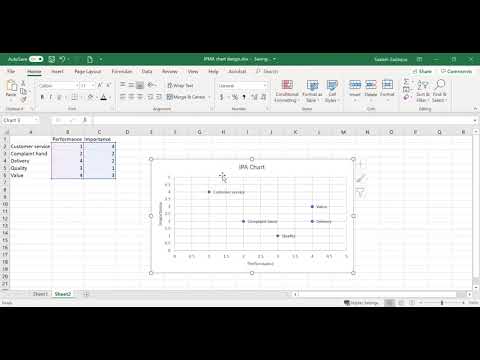
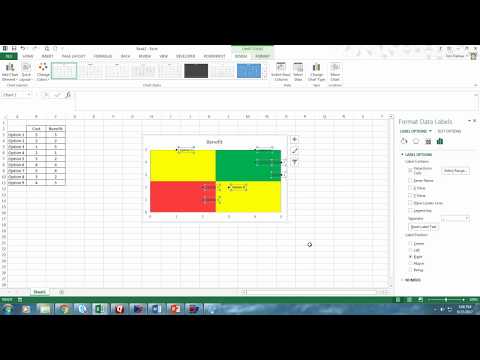
A Quadrant Chart works by Organizing complex information into four distinct quadrants, allowing for a clear and concise visual representation of key aspects. For example, a Quad Chart in project management can divide information into Goals and Objectives, Tasks and Milestones, Resources and Budget, Sales and Complaints, and Risks and Issues.
Comparative analysis:
By plotting data points across two axes, you can easily compare different elements based on their relative positions within the quadrants, revealing important relationships and trends.
Prioritization:
By categorizing data into 4 quadrants based on importance and urgency, users can prioritize tasks or initiatives effectively.
#exceltutorial #exceltips #exceltricks #excelclub #excel #excelformula #quadrant #chart #chartanalysis
Link of Other Videos:
Pareto Chart in Excel | Pareto Analysis in Excel | 80-20 Ration Analysis
Thank You,
Innovative Excel
A corporate learning
Hi Friends,
This Video, we will discuss how to create quadrant chart in excel and what are the benefits of this.
below are some benefits of quadrant chart:
A Quadrant Chart works by Organizing complex information into four distinct quadrants, allowing for a clear and concise visual representation of key aspects. For example, a Quad Chart in project management can divide information into Goals and Objectives, Tasks and Milestones, Resources and Budget, Sales and Complaints, and Risks and Issues.
Comparative analysis:
By plotting data points across two axes, you can easily compare different elements based on their relative positions within the quadrants, revealing important relationships and trends.
Prioritization:
By categorizing data into 4 quadrants based on importance and urgency, users can prioritize tasks or initiatives effectively.
#exceltutorial #exceltips #exceltricks #excelclub #excel #excelformula #quadrant #chart #chartanalysis
Link of Other Videos:
Pareto Chart in Excel | Pareto Analysis in Excel | 80-20 Ration Analysis
Thank You,
Innovative Excel
A corporate learning
 0:05:26
 0:09:30
 0:02:20
 0:09:26
 0:02:31
 0:10:49
 0:05:46
 0:03:52
 0:08:03
 0:09:38
 0:00:17
 0:09:37
 0:07:50
 0:02:32
 0:11:52
 0:00:55
 0:08:55
 0:16:34
 0:09:31
 0:02:57
 0:09:08
 0:05:04
 0:06:30
 0:07:06