filmov
tv
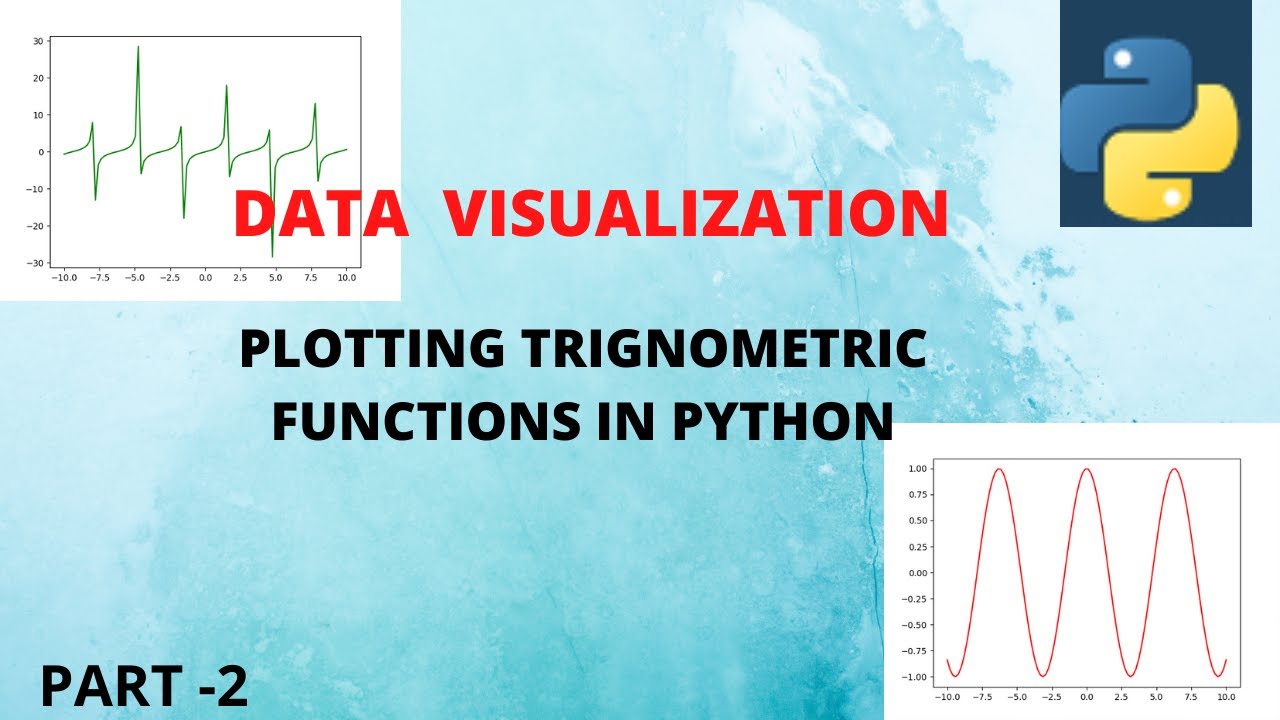
Data Visualization | Matplotlib tutorial -1 How to plot trigonometric functions sin cos in python .
Показать описание
In this video you will get the practical explanation of plotting the trignometric function in python using command line and iPython .
I have used matplotlib library package to plot the graphs in python.
1- how to install matplotlib package
2-how to plot graph in python using command line
3-how to plot graph using iPython interpreter
4-generating points in python
5-plotting sin(x) function
6-plotting cos(x) function
7-plotting tan(x) function
8-how to increase the thickness of graph
9-how to draw coloured graph in python
10-how to draw dotted graph in python
#datavisualization #pythondatavisualization #python #matplotlib #plots
******************************************************
Please like ,share and subscribe
 0:22:01
Intro to Data Analysis / Visualization with Python, Matplotlib and Pandas | Matplotlib Tutorial
 0:15:03
7 Python Data Visualization Libraries in 15 minutes
 0:32:33
Intro to Data Visualization in Python with Matplotlib! (line graph, bar chart, title, labels, size)
 1:31:41
Matplotlib Crash Course
 2:26:01
Matplotlib Mega-Tutorial - Data visualization in Python
 0:32:29
Learn Data Visualization with Matplotlib in Python: A Beginner’s Guide
 0:34:57
Python Matplotlib Tutorial | Matplotlib Tutorial | Python Tutorial | Python Training | Edureka
 0:44:55
Data Visualization Using Matplotlib #tutorial #python #matplotlib #datavisualization
 0:17:13
Unsupervised Learning: Dimensionality Reduction with t-SNE | AIML End-to-End Session 49
 1:02:41
Matplotlib Full Python Course - Data Science Fundamentals
 0:06:43
Learn Matplotlib in 6 minutes | Matplotlib Python Tutorial
 0:25:55
Tutorial 8- Matplotlib (Simple Visualization Library)
 0:20:34
Matplotlib Tutorial (Part 9): Plotting Live Data in Real-Time
 1:01:30
Python Plotting Tutorial w/ Matplotlib & Pandas (Line Graph, Histogram, Pie Chart, Box & Whi...
 0:16:50
Creating Visualizations using Pandas Library | Python Pandas Tutorials
 0:52:46
Data Visualization with matplotlib || Matplotlib Tutorial
 0:05:04
#2 Introduction to Matplotlib for Data visualization in Python | Matplotlib tutorial 2021
 0:52:46
Data Visualization with matplotlib || Matplotlib Tutorial
 0:12:35
Data Science - Python Matplotlib Tutorial for Data Visualization
 0:00:14
Data Visualization using Python Matplotlib Library | Data Science | #datascience #dataanalytics
 0:07:30
Python Data Visualization | Matplotlib | Seaborn | Plotly-1
 0:27:37
Python Data Visualization | Matplotlib | Seaborn | Plotly: Matplotlib Line Chart
 1:34:00
Matplotlib Tutorial : Matplotlib Full Course
 0:01:00
Visualizing Data with Matplotlib 📊 | Python #datascience #matplotlib #datavisualization
Комментарии