filmov
tv
2-Sample Proportion (% Defectives) Test: Illustration with Practical Example in Minitab
Показать описание
#HypothesisTest #2SampleProportionTest #2SampleTest #HypothesisTestsWithPracticalExamples #HypothesisTestForAttributeData #2SampleTestInExcel #2SampleTestInMinitab #2SampleProportionTestInMinitab #2SamplePercentageDefectivesTest #2SamplePercentageDefectivesTestInMinitab #2%DefectivesTest
Hello Friends,
Till the last videos on hypothesis test to compare 2 samples with each other, we had completed the learning of hypothesis tests for continuous data.
In this video, we are going to learn the 1st hypothesis test to compare 2 samples with each other for attribute data i.e. 2-Percentage Defectives Test or 2-Sample Proportion Test in Minitab software with the help of a practical example for easy understanding and better clarity.
This video consists of the following topics:
• What is the 2-Sample Proportion (% Defectives) Test in Hypothesis testing?
• Hypotheses for 2-Sample Proportion (% Defectives) Test
• Data considerations for 2-Sample Proportion (% Defectives) Test
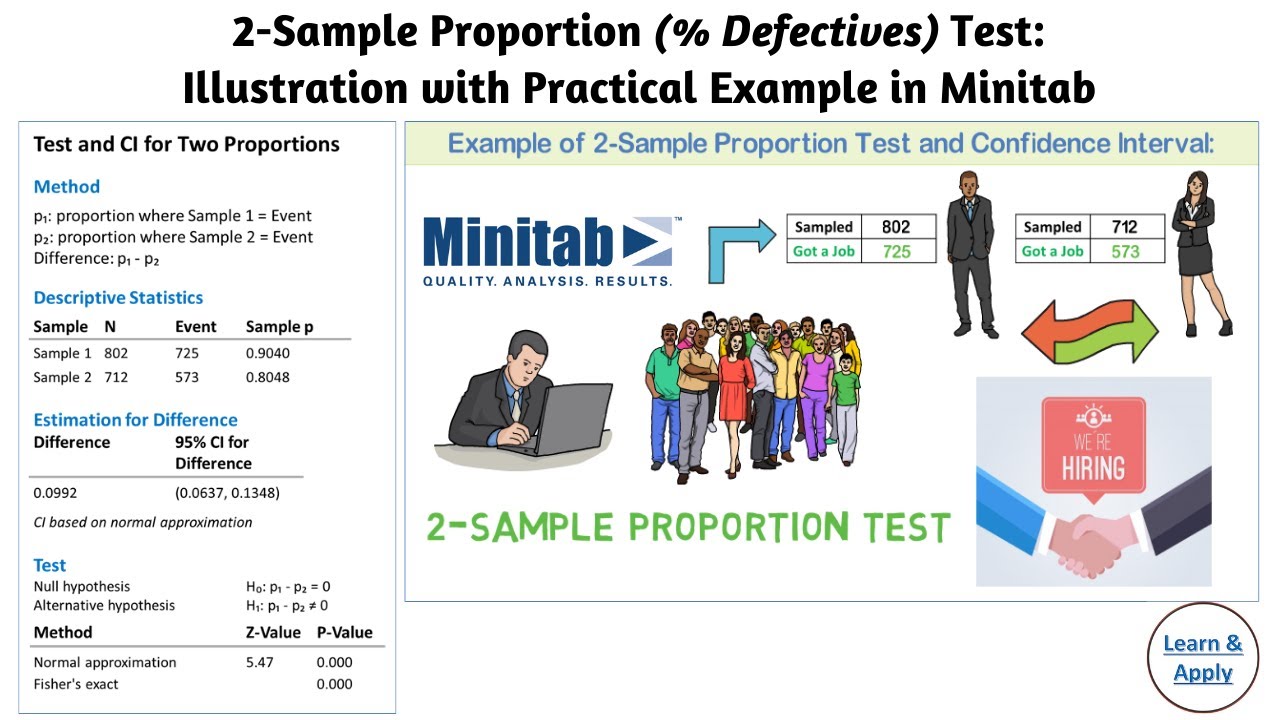
• Example of 2-Sample Proportion (% Defectives) Test and Confidence Interval
• Conduct 2-Sample Proportion (% Defectives) Test in Minitab with a practical example
• Detailed interpretation of results from 2-Sample Proportion (% Defectives) Test including Descriptive Statistics, Estimation for the difference in proportions (% defectives), p-value & its interpretations and finally the conclusion.
I am sure, you will be liked it.
You can also access this training by visiting our website-
We have also updated the “Our Services” page on this website to select the most appropriate program to improve your profitability and employee engagement.
And finally, thank you for watching…
-~-~~-~~~-~~-~-
Please watch: "Design of Experiment (DOE): Introduction, Terms and Concepts with Practical Example- PART 1"
-~-~~-~~~-~~-~-
Hello Friends,
Till the last videos on hypothesis test to compare 2 samples with each other, we had completed the learning of hypothesis tests for continuous data.
In this video, we are going to learn the 1st hypothesis test to compare 2 samples with each other for attribute data i.e. 2-Percentage Defectives Test or 2-Sample Proportion Test in Minitab software with the help of a practical example for easy understanding and better clarity.
This video consists of the following topics:
• What is the 2-Sample Proportion (% Defectives) Test in Hypothesis testing?
• Hypotheses for 2-Sample Proportion (% Defectives) Test
• Data considerations for 2-Sample Proportion (% Defectives) Test
• Example of 2-Sample Proportion (% Defectives) Test and Confidence Interval
• Conduct 2-Sample Proportion (% Defectives) Test in Minitab with a practical example
• Detailed interpretation of results from 2-Sample Proportion (% Defectives) Test including Descriptive Statistics, Estimation for the difference in proportions (% defectives), p-value & its interpretations and finally the conclusion.
I am sure, you will be liked it.
You can also access this training by visiting our website-
We have also updated the “Our Services” page on this website to select the most appropriate program to improve your profitability and employee engagement.
And finally, thank you for watching…
-~-~~-~~~-~~-~-
Please watch: "Design of Experiment (DOE): Introduction, Terms and Concepts with Practical Example- PART 1"
-~-~~-~~~-~~-~-
 0:09:04
2-Sample Proportion (% Defectives) Test: Illustration with Practical Example in Minitab
 0:10:35
Hypothesis Testing With Two Proportions
 0:16:46
Calculate a Two Proportions Z test - Formal Procedure for Defects
 0:05:20
2.0 Two Sample Proportion Test
 0:11:08
Hypothesis Test for 2 Proportion Samples
 0:03:09
Sample Proportions
 0:10:34
Problem 4 - Test for Two Proportions - BSc Statistics
 0:14:09
Z test - 18 - Imp Exam problems - Two Proportions - Has The Machine Improved
 0:13:51
Two-Sample Z-Test for Proportions
 0:09:14
2 proportion z test example
 0:11:05
Comparing two population proportions | Hypothesis testing L16
 0:08:59
Hypothesis Testing - One Sample Proportion Test
 0:11:13
Left Tailed Hypothesis Test for Population Proportion
 0:32:16
Intro Statistics, Lecture 22A, Hypothesis Testing for Proportions
 0:06:44
Confidence Interval for a population proportion | Solved Problems
 0:08:22
Problem 2 - Test for Two Proportions - BSc Statistics || in Telugu ||
 0:12:31
Hypothesis Testing - One Sample Proportion Test Example
 0:17:45
Z-test - Hypothesis Testing For Population Proportion
 0:02:56
BSTA305 - Ch 11 - Pb 5: 2 Samples Hypothesis Testing - Proportion
 0:03:28
2-Proportion Hypothesis Test is Minitab
 0:07:30
Two Proportion Minitab Example
 0:08:45
Z Test for Population Proportion with Example Problem | Hypothesis Testing Statistics
 0:05:55
Two Sample Significance Test for Proportions
 0:05:15
Example 4 for Two Proportion Tests
Комментарии