filmov
tv
Performance Testing JSON in SQL Server vs C#

Показать описание
A case study in why JSON performance in SQL Server is much better than I originally thought.
Performance testing in SQL Server is hard enough. When you start trying to compare SQL Server functions to code in .NET, lots of of other factors come in to play.
This video examines five JSON performance tests and describes what to consider when performance testing in SQL Server vs other languages.
Elsewhere on the internet:
Performance Testing JSON in SQL Server vs C#
 0:58:32
JSON Usage and Performance in SQL Server 2016 Bert Wagner
 0:10:41
One SQL Cheat Code For Amazingly Fast JSON Queries - SQL JSON Index performance
 0:05:57
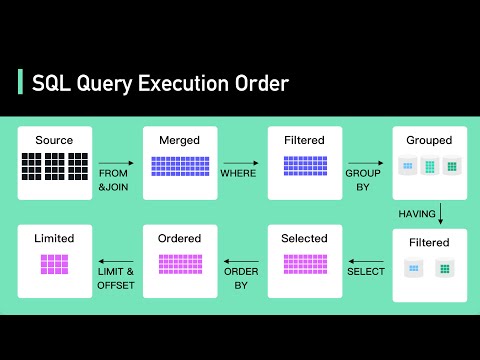
Secret To Optimizing SQL Queries - Understand The SQL Execution Order
 0:08:08
How to load JSON file to SQL Server?
 0:38:37
Performance Tips for JSON in Oracle Database
 0:17:46
XML vs JSON in SQL Server 2016
 0:00:18
Convert a JSON file to a SQL Database in 30 seconds
 0:20:02
Impact of storing JSON data in MySQL | Partial JSON updates in Binary log | Performance | MySQL 8
 0:28:06
How to Work with JSON Data in SQL Server (Simple and Complex JSON)
 0:19:28
JSON Data Improvements in MySQL 8.0
 0:27:34
Get Better Database Performance. Learn from SQL Server / MongoDB Experts
 0:54:19
Using JSON with SQL Server 2016
 0:22:41
Store and analyze JSON data using the Oracle API for MongoDB and SQL/JSON I Oracle Database World
 0:32:59
Part-5| SDET Essentials| How to Convert Database Results into JSON Files
 0:19:31
Part-4| SDET Essentials| How to Convert Database Results into JSON Files
 1:11:57
DBAs vs Developers: JSON in SQL Server 2016 with Bert Wagner
 0:47:26
SQL for JSON: Querying with Performance for NoSQL Databases & Applications by Arun Gupta
 0:00:44
Difference JSON AUTO & PATH In SQL SERVER | Part 12 #sqlserver #dataqueries
 0:43:08
Deep dive: Using JSON with SQL Server
 0:09:11
Generating Multi-Object JSON Arrays in SQL Server
 0:20:33
Using JSON in MySQL to get the best of both worlds (JSON + SQL) by Chaithra Gopalareddy
 0:07:05
SQL Server - Working with JSON Data
 0:05:30
MySQL vs MongoDB
Комментарии