filmov
tv
Statistics: Ch 2 Graphical Representation of Data (17 of 62) Mean or Average

Показать описание
We will calculate the MEAN (average) of 5 houses sold in 2018 in Town A and Town B, and why average in not always a good indicator of what is really happening with the data.
To donate:
.
Next video in this series can be seen at:
 0:03:14
Statistics: Ch 2 Graphical Representation of Data (1 of 62) Types of Graphs
 0:10:17
Statistics: Ch 2 Graphical Representation of Data (29 of 62) Standard Deviation: Example
 0:06:22
Statistics: Ch 2 Graphical Representation of Data (33 of 62) Standard Deviation: With Sample Data
 0:03:07
Statistics: Ch 2 Graphical Representation of Data (22 of 62) Range
 0:05:23
Statistics: Ch 2 Graphical Representation of Data (35 of 62) Test for Normality: Ex 1
 0:05:52
Statistics: Ch 2 Graphical Representation of Data (15 of 62) Ogive: A Closer Look
 0:01:50
Statistics: Ch 2 Graphical Representation of Data (3 of 62) The Bar Graph
 0:04:35
Statistics: Ch 2 Graphical Representation of Data (28 of 62) What is Standard Deviation?
 0:04:20
Statistics: Ch 2 Graphical Representation of Data (10 of 62) Classes (Groups)
 0:02:37
Statistics: Ch 2 Graphical Representation of Data (38 of 62) What are Quartiles?
 0:03:15
Statistics: Ch 2 Graphical Representation of Data (20 of 62) Midrange
 0:07:15
Statistics: Ch 2 Graphical Representation of Data (31 of 62) The New Variance Equation Derived
 0:04:31
Statistic: Ch 2 Graphical Representation of Data (42 of 62) How to Calculate the 1st Quartile: Ex 4
 0:06:00
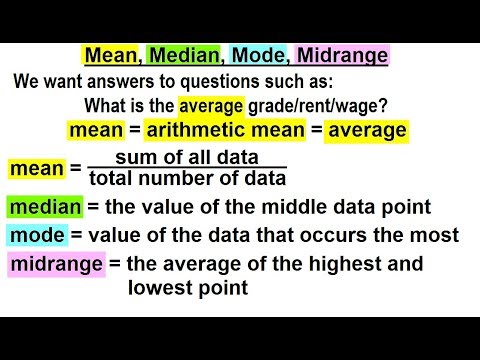
Statistics: Ch 2 Graphical Representation of Data (16 of 62) Mean, Median, Mode, Midrange
 0:01:48
Statistics: Ch 2 Graphical Representation of Data (11 of 62) Histogram (Frequency)
 0:04:43
Statistics: Ch 2 Graphical Representation of Data (19 of 62) Mode
 0:03:01
Statistics: Ch 2 Graphical Representation of Data (37 of 62) Measure of Posistion
 0:04:52
Statistics: Ch 2 Graphical Representation of Data (17 of 62) Mean or Average
 0:05:00
Statistics: Ch 2 Graphical Representation of Data (26 of 62) Variance or Sample Variance
 0:04:59
Statistic: Ch 2 Graphical Representation of Data (50 of 62) Calculating Percentile: Method 4
 0:04:14
Statistics: Ch 2 Graphical Representation of Data (46 of 62) What is Percentile?
 0:06:06
Statistics: Ch 2 Graphical Representation of Data (39 of 62) How to Calculate the 1st Quartile: Ex 1
 0:03:13
Statistics: Ch 2 Graphical Representation of Data (41 of 62) How to Calculate the 1st Quartile: Ex 3
 0:02:13
Statistics: Ch 2 Graphical Representation of Data (54 of 62) Box and Whisker Display
Комментарии