filmov
tv
Chapter 15: Equilibrium - K, Q, and ICE charts

Показать описание
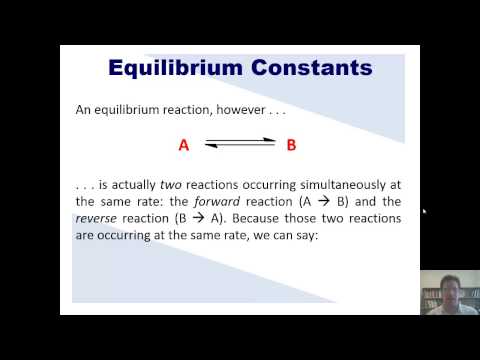
The study of chemical equilibria often uses ICE charts. ICE charts help us to keep track of the Initial conditions of a chemical reaction, the Change that the reaction undergoes to reach equilibrium, and the Equilibrium conditions. The equilibrium constant, K, is a useful tool for analyzing chemical equilibria. K allows us to determine when a reaction is at equilibrium or not. To do this, we calculate Q, the reaction quotient, which has the same form as K. However, K can only be calculated at equilibrium while Q can be calculated for any conditions. If K = Q, the reaction is at equilibrium. If Q is less than K, the reaction must proceed toward products to reach equilibrium. If Q is greater than K, the reaction must proceed toward reactants to reach equilibrium.
 0:28:41
 0:53:22
 0:09:49
 0:10:01
 0:22:48
 0:23:04
 1:05:26
 0:23:45
 1:17:02
 0:03:05
 0:10:07
 0:10:58
 0:26:40
 0:04:54
 0:02:42
 0:05:20
 0:08:08
 0:09:34
 0:12:35
 1:20:25
 0:06:17
 0:04:30
 0:12:09
 0:14:15