filmov
tv
Graphing Exponential Growth and Decay: Practice
Показать описание
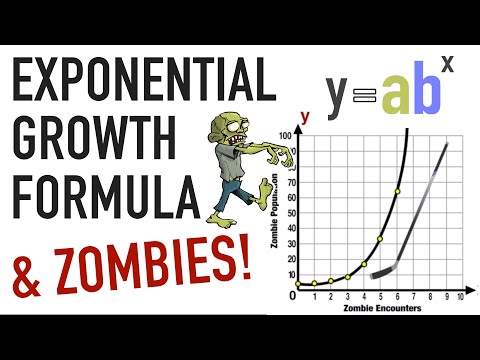
This video continues with the idea of graphing exponential growth and decay functions when the equation for the function is given by looking at a couple more example problems from the Khan Academy exercise linked below.
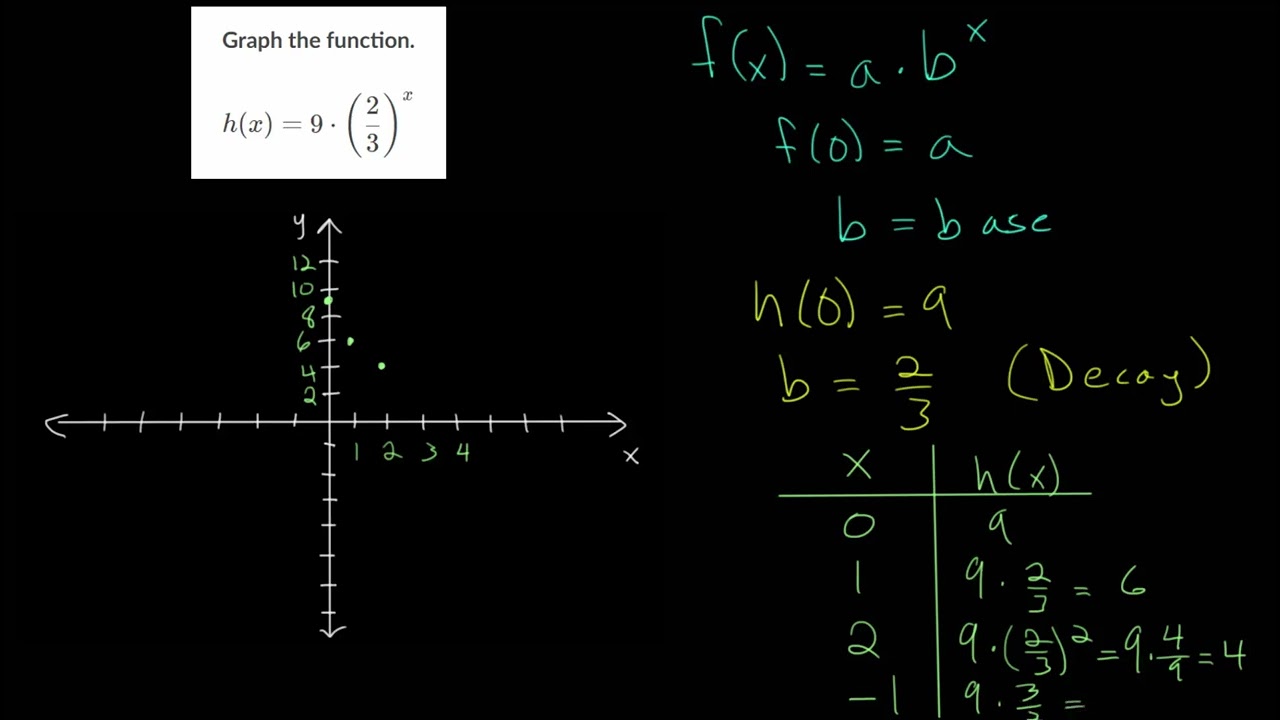
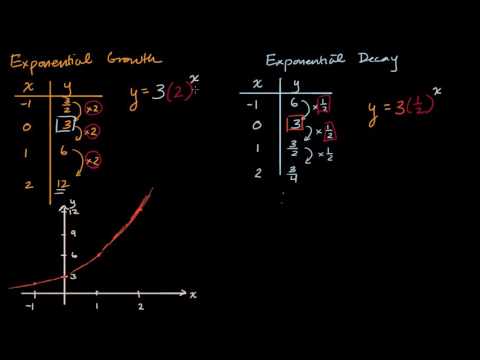
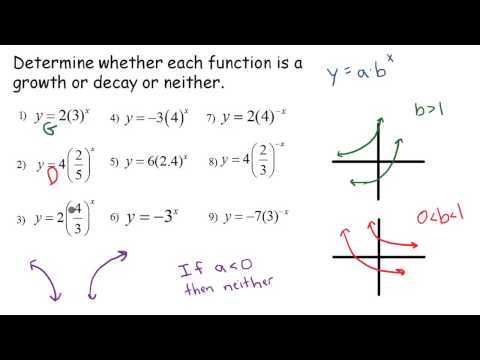
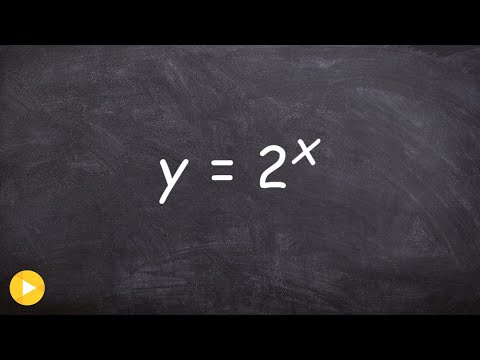
The function can be compared to its general form, f(x) = a*b^x, where a is the value of the function when x = 0 and b is the base of the function. If b is greater than 1, the function exhibits exponential growth. If b is less than one, the function shows exponential decay.
The simplest way to graph the function is to make a table and plug in various x values to see what the y values or function values would be. Start with x = 0, then move to x = 1, and so on. It may be useful to plot some points on the graph when x is negative as well.
Khan Academy exercise to practice:
 0:04:05
 0:10:49
 0:12:03
 0:05:52
 0:31:44
 0:05:51
 0:07:45
 0:05:59
 0:01:50
 0:45:07
 0:07:41
 0:03:57
 0:05:33
 0:22:50
 0:08:27
 0:08:51
 0:10:38
 0:08:11
 0:01:42
 0:12:07
 0:00:38
 0:03:22
 0:06:23
 0:08:34