filmov
tv
Sine & Cosine - Amplitude, Frequency & Period - [2-21-9]

Показать описание
In this lesson, you will learn how to graph sine and cosine functions when we alter the amplitude, frequency, or period of the function. The amplitude relates to the maximum and minimum value of the wave. The frequency relates to how many cycles per second the wave oscillates. The period is the inverse of the frequency and relates to how long it takes for one oscillation to occur.
 0:09:57
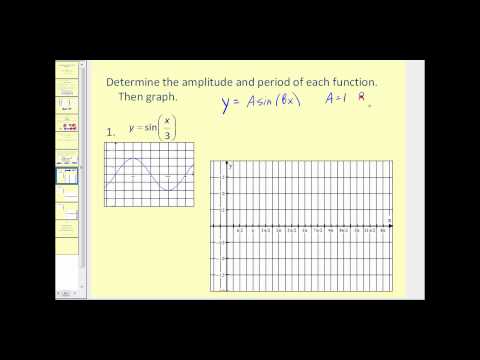
Amplitude and Period of Sine and Cosine
 0:56:57
Sine & Cosine - Amplitude, Frequency & Period - [2-21-9]
 0:00:27
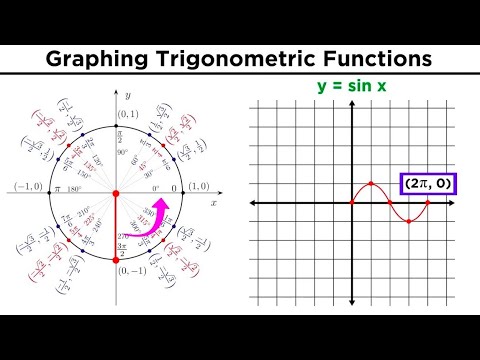
Sine Curve and the Unit Circle
 0:03:48
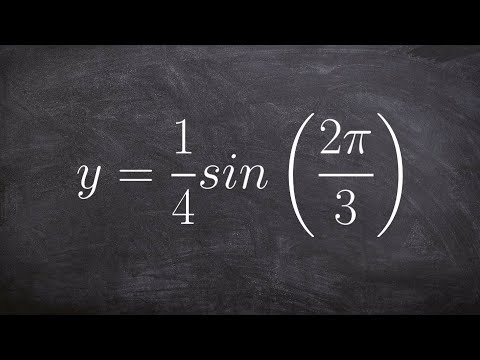
How to Find the Period and Amplititude of the Equation of Sine
 0:22:37
How To Graph Trigonometric Functions | Trigonometry
 0:01:21
How to Find the Amplitude and Period of the Cosine Equation
 0:11:40
Graphing Trigonometric Functions
 0:03:43
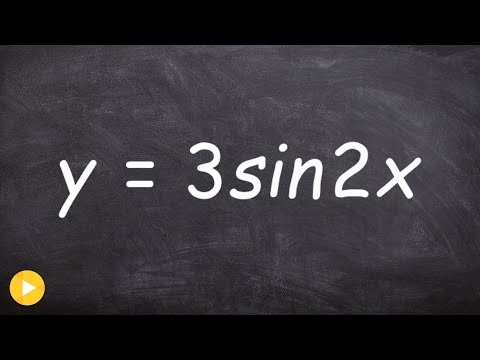
Graphing a Sine Function by Finding the Amplitude and Period
![[Eng][CM2024] L19](https://i.ytimg.com/vi/Q-fDM2BNs4c/hqdefault.jpg) 1:15:26
1:15:26
[Eng][CM2024] L19
 0:02:05
Topic: Amplitude and Period of Sine and Cosine Functions
 0:01:59
Finding the Period and Amplitude of a Graph
 0:04:23
How do you find the amplitude of the sine and cosine graph
 0:06:20
Sine or Cosine Writing Equations Given Graph
 0:12:00
Graphing Sin and Cos
 0:04:58
Midline, amplitude and period of a function | Graphs of trig functions | Trigonometry | Khan Academy
 0:04:50
Trigonometric Functions and Graphing: Amplitude, Period, Vertical and Horizontal Shifts, Ex 2
 0:04:03
How to Graph Amplitude and Period in Trigonometry Graphing #trigonometry #math #mathematics
 0:06:00
What is the period, frequency and amplitude of sine and cosine graphs
 0:14:07
Graphing Sine and Cosine Functions with Transformations (Multiple Examples)
 0:07:55
Amplitude, period, vertical shift, and phase shift
 0:05:22
Amplitude and period (trigonometry3)
 0:14:50
Introduction to Graphing Sine/Cosine Waves and Amplitude
 0:12:52
Example: Amplitude and period transformations | Trigonometry | Khan Academy
 0:02:06
Learn How to Find the Amplitude Period and Frequency of Sine
Комментарии