filmov
tv
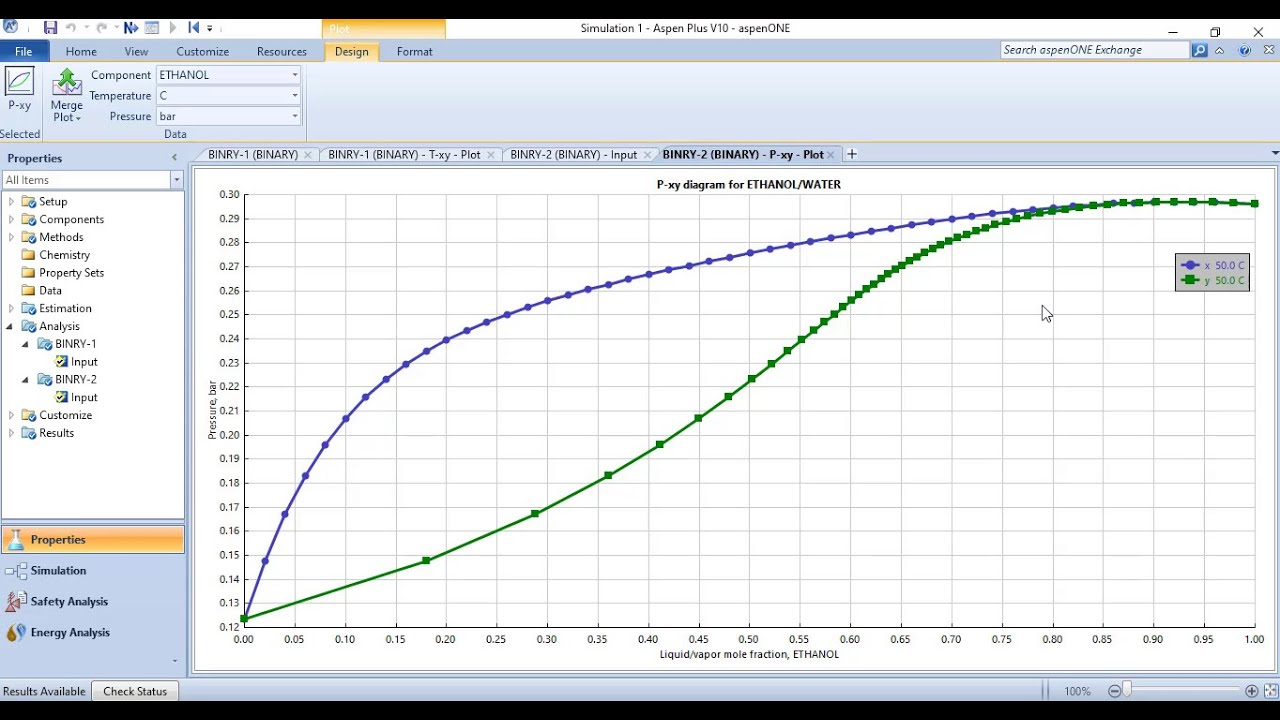
Generating Txy and Pxy Diagrams (Binary Phase Diagrams) in Aspen Plus
Показать описание
Let's Create #Pxy and #Txy #VLE diagrams in #Aspen_Plus for Ethanol, Water and Methanol. These phase diagrams are very important in analyzing Binary mixtures, indicating some crucial properties of vapor-liquid equilibrium like #bubble point, #dew point, #azeotrope formation etc.
Apart from step procedure, comments regarding the selection of Property package (theory and uses) and binary parameters estimation has also been made.
Hope you guys will like this video. Hit LIKE, SUBSCRIBE my channel to support me, and don't forget to give RECOMMENDATIONS in the comment section below.
Say it Loud
It's ChemE
 0:13:04
Generating Txy and Pxy Diagrams (Binary Phase Diagrams) in Aspen Plus
 0:14:53
Txy and Pxy Diagrams
 0:03:45
P-x-y and T-x-y Diagrams for Vapor-Liquid Equilibrium (Interactive Simulation)
 0:09:30
Vapor liquid Equilibrium -VLE -Txy diagram example.
 0:15:57
Txy and Pxy Diagrams in Aspen HYSYS
 0:10:07
Binary Phase Diagram (Txy and xy)
 0:03:08
y-x Phase Diagram for VLE of a Binary Mixture
 0:07:02
Aspen Plus | Txy , Pxy and yx vapor liquid equilibrium (VLE) diagrams
 0:01:24
Txy and Pxy Diagrams
 0:10:00
Chapter 6.4 Txy and Pxy Diagram for Binary System (Principle of Chemical Processes)
 0:24:20
1.3: Making Txy and Pxy diagrams in Excel (ECH4403 F20)
 0:03:55
Plotting a T-XY diagram in Excel
 0:10:02
Chapter 11: Txy for a Binary System using Raoult's Law Example
 0:14:08
Pxy Txy Diagram
 0:04:42
Generation of xy, Txy, Pxy diagrams for a binary mixture using Aspen HYSYS - Lecture # 66
 0:20:15
Construction of P-xy and T-xy diagram | Phase Equilibria |Goal Seek in excel
 0:04:03
Plotting a P-XY diagram in Excel
 0:34:50
Lecture 13 - Raoult’s Law, Txy and Pxy diagrams (Feb. 14, 2018)
 0:25:18
'Generate VLE Diagrams for Ethanol-Benzene Azeotrope in Python | Pxy & Txy Plots Tutorial&a...
 0:10:45
Pxy & Txy Diagram
 0:01:38
Chapter 7.1: Finding Thermophysical Properties and Generating TXY Diagrams
 0:07:32
Distillation | T x y plot | Vapor liquid equilibrium data using Raoult's and Dalton's law ...
 0:03:08
T-x-y Diagram for Vapor-Liquid Equilibrium of a Binary Mixture
 0:12:34
T-xy, P-xy, and y-x diagrams for a binary mixture using Aspen Plus - Lecture # 37
Комментарии