filmov
tv
Adding Max and Min Slope lines in Excel (QCAA approach)

Показать описание
For my Senior Physics Class: I promised you a video showing how to add lines of max and min slopes to an excel graph. Here 'tis. Enjoy!
EDIT: There's one more step I'd recommend, and that is to remove the "markers" from the max and min slope lines to make them a bit cleaner. (Double-click on those lines and use the menu on the right of the screen)
CAVEAT: To the mathematical purists: This video is a simple (simlistic?) implementation of the QCAA Physics syllabus's prescribed approach to creating max and min sloped lines. It is definitely NOT the most mathematically precise or elegant solution. It would be better to use Std. Dev. or Std. Err. instead of uncertainty of the mean, and there are better ways to determine the min and max lines. I'm not endorsing this method, just showing you how to implement it in Excel.
 0:12:00
Adding Max and Min Slope lines in Excel (QCAA approach)
 0:02:23
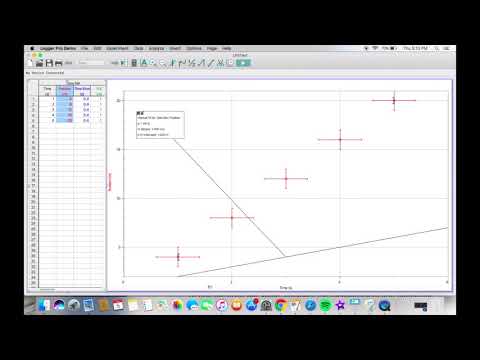
LoggerPro | How to Add a Maximum and Minimum Slope
 0:21:52
Max and min slope with Excel
 0:05:37
Max and Min Slopes (Slope Uncertainty) IB Physics
 0:22:50
Max/Min Slope Lines & Slope Calculations in Excel
 0:07:48
Max and Min Slope Possible Lines
 0:12:27
Max and Min Slope Lines IB Physics
 0:10:00
Max and Min Slope
 0:13:31
Excel part 6: Max/Min Slope
 0:15:01
Slope Uncertainty IB Physics Excel
 0:04:43
IB - How to draw the maximum and minimum slope lines
 0:17:54
How to Graph Using Error Bars and Max/Min Slope
 0:07:37
logger pro graphing, max and min lines
 0:17:45
Determining Error in the Slope Using Maximum and Minimum Gradients
 0:12:20
Making the Maximum and Minimum Line of Best Fit on Logger Pro - IB Physics
 0:01:02
How to Find the Slope Using Excel (Short Version)
 0:10:08
Plumbing Slope Rule and Why it is CRITICAL
 0:09:51
Max and Min with Slope Formula
 0:09:39
IB Practical T2.1 - Part 4 - Min & Max Slope
 0:06:17
Constructing lines of maximum and minimum slope
 0:38:51
Graphing Trend-lines, Maximum and Minimum Slope and Error Bars in Excel
 0:28:36
Error bars, Max & Min line on the graph - IB Physics
 0:19:20
Min & Max Slope with Ohms Law
 0:20:45
DP Physics IA : Min and Max slope using iPad pt1/2
Комментарии