filmov
tv
Explain the Calibration Curve method & Standard addition method | Spectroscopy | Analytical

Показать описание
The concentration of unknown in flame photometry is determined by two methods:
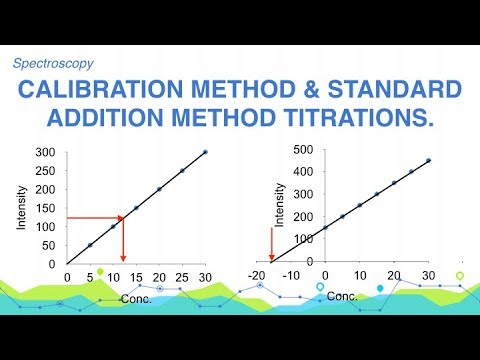
(i) Calibration method: We take some known concentration of the given soln and find the intensity of the emitted light. A graph of intensity measured Vs Conc is plotted. Now the intensity of the test solution is measured. Take this value on the intensity axis and draw the line parallel to the X-axis where it cuts the standard curve, from there draw the perpendicular to the conc axis which will give the concentration.
(ii) Standard addition method: In this method the intensity of the light of the test solution is measured with reference to the blank. Now known increasing amount of the element to be determined are then added to a number of the test solutions and the solutions are diluted to the same volume in each case. Intensity of the light of each solution is determined. A graph of readings Vs slandered conc added is plotted the graph will be straight line this line is extrapolated on conc axis which gives the concentration.
Analytical Reasoning
English Grammar
Interview Skills
Managerial Economics
Royalty Free Stock Footage
Chemical Thermodynamics - Physical Chemistry
Ionic Equilibria - Physical Chemistry
Electrochemistry - Physical Chemistry
Solid State - Physical Chemistry
Gaseous State - Physical Chemistry
Colloidal States - Physical Chemistry
Stereochemistry - Organic Chemistry
Nanomaterials - Engineering Chemistry
Water and Its Treatment - Engineering Chemistry
Electrochemistry - Engineering Chemistry
Environmental Studies
Optics - Applied Physics
For Details Visit
#CalibrationCurveMethod #StandardAdditionMethod #Spectroscopy #AnalyticalChemistry #Chemistry
 0:02:23
Explain the Calibration Curve method & Standard addition method | Spectroscopy | Analytical
 0:11:58
Spectrophotometers, calibration curves and Beer's Law
 0:08:00
Calibration Curves 101 (UPDATED)
 0:02:16
Determination of Unknown Concentration Using Calibration Curve
 0:05:50
FA18 Calibration Curves
 0:27:17
Calibration Curves, Blanks, and Method Verification Terminology
 0:14:54
Calibration Curves
 0:15:04
Calibration Methods
 0:06:34
Using Standard Curve to solve for Unknown Concentration
 0:06:52
What is a Standard Curve?
 0:08:01
Generating Standard Curve and Determining Concentration of Unknown Sample in Excel - Easy Method
 0:06:56
AAS PART 2: Calibration Curves Explained
 0:01:48
Calibration Curve
 0:05:04
External calibration
 0:05:46
How to build a calibration curve
 0:11:54
A full explanation about Bradford assay, Coomassie Brilliant Blue and the calibration curve
 0:20:48
External Standard , Internal Standard, and Standard Addition | Chemistry with Dr. G
 0:06:02
Calibration Curves
 0:07:58
LabSolutions LC/GC WorkStation Creating a Calibration Curve
 0:00:55
How to make calibration curve
 0:08:52
Analytical Science: Standard Additions Calibration
 0:00:36
Ask the expert: How can I tell if a calibration curve is good?
 0:06:38
How to Set up HPLC calibration curve - External Standard Calibration Method
 0:03:43
Using Standard Curve to Estimate DNA Quantity - Forensic Focus #4
Комментарии