filmov
tv
Inside Wireless: 3D Antenna Radiation Pattern

Показать описание
The 3D antenna radiation diagram is one of the most important antenna characteristics.
Main video takeaways:
- 2D plot (polar or other) gives a limited information about antenna radiation pattern
- 3D plot gives a complete information about antenna radiation pattern
- When a 2D plot is enough is a question of application. In WISP industry for example, a 3D one is necessary since all the antenna side lobes matter due to the noise being the no. 1 problem in unlicensed frequency bands.
Generally, the gain radiation pattern says what is the radiation intensity of the EM fields an antenna radiates in any direction. A 2D pattern gives this information in a selected two dimensional cut, most commonly in two planes perpendicular to each other - the 2 cuts give a limited information compared to the full 3D radiation pattern showing the gain in all three dimensions.
Isotropic antenna is a theoretical antenna that radiates with the same intensity in every direction. Its radiation pattern is therefore a sphere - drawing the radiation intensity in a given direction as vectors and connecting their tips, we get a surface which is the 3D radiation diagram.
The same can be done for any other antenna - the direction and strength of its radiation at any point in space can be expressed by a vector - with direction and amplitude. Connecting the tips of all the vectors forms a spatial image, we call 3D radiation diagram.
Since no real antenna is isotropic, let’s look at a parabolic dish - probably the most common antenna type. It focuses the EM wave energy in the direction of its main axis and it’s strongest there. Besides that it also has side lobes that are weaker than the main lobe, and are mostly unwanted especially in the unlicensed frequency bands where interference is the no. 1 problem.
Same thing here as with the isotropic antenna - we can plot the vectors from the origin on the whole spherical surface, but now, because the parabolic dish does not radiate equally everywhere, the vectors will have varying lengths depending on direction. Connecting the tips of the vectors, we get the 3D radiation pattern of this antenna.
3D vs 2D DIAGRAMS
The 3D diagram provides complete information about the gain of an antenna, since it shows the gain in every possible direction in 3D space - you cannot do better than that. This is why it is generally more useful than the 2D plot which is obtained from the 3D plot anyway - by selecting a specific slice from the 3D diagram.
The 3D diagram is more difficult to obtain than the 2D one, so historically the 2D plots became the standard in most engineering fields, but today, with powerful computers available to everyone and advanced antenna measurement setups capable of full 3D measurements, the difference is diminishing, but we’ll talk about that in another episode.
0:00 - Introduction
0:40 - 3D radiation pattern definition
1:10 - Isotropic antenna example
2:00 - Parabolic dish example
2:55 - When a 3D diagram is better?
3:29 - Historical perspective
#RFelements #InsideWireless #3DradiatiponPattern #AntennaRadiationPattern #RadiationDiagram #Antennas #AntennaTheory #WISP #SaveSpectrum #RejectNoise #growsmart #UbiquitiNetworks #CambiumNetworks #MimosaNetworks #Mikrotik
 0:04:17
Inside Wireless: 3D Antenna Radiation Pattern
 0:02:14
Inside Wireless: Radiation Diagram
 0:01:47
Inside Wireless: Measurement of Antenna Radiation Pattern
 0:02:08
Inside Wireless: Antenna Beam Width
 0:04:08
Inside Wireless: 𝜼 - Antenna Radiation Efficiency
 0:02:38
Inside Wireless: Antenna Gain
 0:02:25
Inside Wireless: Beam Efficiency Definition
 0:06:03
IMAGE 5G project – 3D antenna radiation pattern measurements
 0:08:02
How does an Antenna work? | ICT #4
 0:03:28
Inside Wireless: How RF coverage works
 0:02:08
Inside Wireless: Side Lobes
 0:02:36
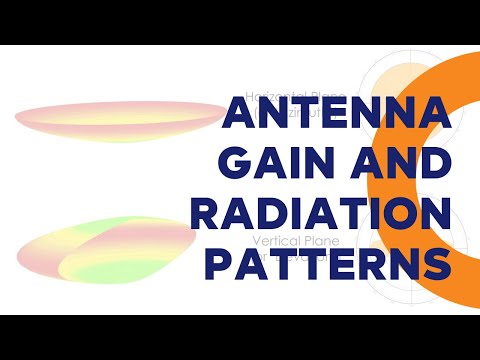
An introduction to Antenna Gain and Radiation Patterns
 0:02:52
Inside Wireless: Fresnel Zones
 0:03:19
Inside Wireless: Antenna Array
 0:02:20
Inside Wireless: Gain Measurement
 0:01:23
The flow of the 3D Radiation Pattern Measurements using ME1310 Antenna and Propagation (3D)
 0:04:33
How Does An Antenna Work? | weBoost
 0:02:16
Poynting LPDA-92 antenna 3D Radiation patterns
 0:02:00
Inside Wireless: Frequency Dependence of Antenna Patterns
 0:09:16
Access Points And Antenna Radiation Patterns
 0:00:49
Mobile Phone vs Steel Wool I How Your iPhone Will Damage Your Brain
 0:01:12
What are antenna radiation patterns?
 0:00:50
ATPL Radio Navigation | Radiation pattern of a half-wave dipole antenna | 3D animation
 0:03:28
Antenna Radiation Pattern
Комментарии