filmov
tv
Python Tutorial : Hypothesis tests
Показать описание
---
You just found that the mean active bout length for mutant fish that have inhibited melatonin production is much longer than for wild type fish that have normal melatonin production.
This is especially clear if we look at the confidence intervals graphically. Obviously, there is an effect on activity due to mutation of this gene.
In addition to mutant fish, Prof. Prober's lab also studied heterozygotic fish. These are fish that have one mutated copy of the gene and one functional copy, unlike the mutant, which has two mutated copies, or wild type, which has two functional copies.
When we do the same analysis of the heterozygote, we see that the effect is much smaller.
Indeed, if we look at the ECDFs of active bout length, here with the x-axis range adjusted for ease of comparison, we see only a slight difference between the wild type and heterozygotic fish.
We have quantified the differences, and we can see them graphically, but now is a good time to test the hypothesis that there is no difference between the heterozygotic and wild type fish.
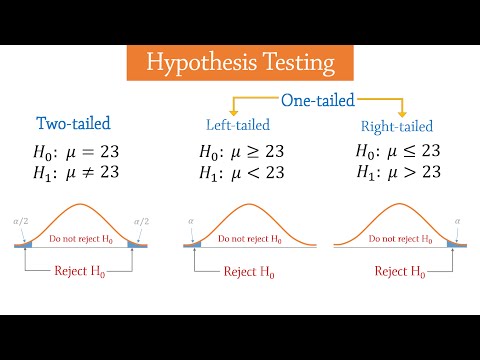
A hypothesis test is an assessment of how reasonable the observed data are assuming a hypothesis, called the null hypothesis, is true.
The result of a hypothesis test is a p-value, defined as the probability of obtaining a value of your test statistic that is at least as extreme as what was observed, under the assumption the null hypothesis is true.
As a reminder, a test statistic is a single number that can be computed from observed data and from data you simulate under the null hypothesis to serve as a basis of comparison.
The p-value only makes sense if the null hypothesis, test statistic, and the meaning of "at least as extreme as" are clearly defined.
So, the pipeline for doing a hypothesis test is to clearly state the null hypothesis and the test statistic. Then you simulate production of the data as if the null hypothesis were true. For each of these simulated data sets, compute the test statistic. The p-value is then the fraction of your simulated data sets for which the test statistic is at least as extreme as for the real data.
Let's consider now the hypothesis that the active bout lengths of wild type and heterozygotic fish are identically distributed. We will use the difference in means of the active bout lengths as a test statistic, and consider test statistics greater than or equal to what was observed to be "at least as extreme as."
The hypothesis says that wild type and heterozygotic fish are completely indistinguishable with respect to their active bout lengths. To simulate this, you can scramble which bout lengths are labeled "wild type" and which are labeled "heterozygote" and compute the test statistic. You do this over and over again to get many permutation replicates. This is called a *permutation test*.
You implemented this in the `draw_perm_reps()` function of the `dc_stat_think` module. The first two arguments are the two data sets you are comparing in the hypothesis test. The third argument is a function used to compute the test statistic. You already wrote one to do difference of means, and it is also included in the `dc_stat_think` module. The last argument says how many replicates to generate.
Finally, the p-value is computed as the fraction of replicates at least as extreme as what was observed.
Now you can go ahead and practice these techniques with zebrafish active bouts.
#DataCamp #PythonTutorial #CaseStudiesinStatisticalThinking #StatisticalThinking
 0:03:57
Python Tutorial : Hypothesis tests
 0:20:07
Python for Data Analysis: Hypothesis Testing and T-Tests
 0:21:23
Property-Based Testing In Python: Hypothesis is AWESOME
 0:08:07
What is a hypothesis test? A beginner's guide to hypothesis testing!
 0:09:15
Hypothesis Testing - T test using Python
 0:13:56
What is Hypothesis Testing ? Math, Statistics for data science, machine learning
 1:40:27
Statistical Hypothesis Testing Using Python Explained Full in Webinar | Part 1 | Learnbay
 0:00:51
Hypothesis Testing 🔥 Explained in 60 Seconds
 0:00:26
How do you conduct an ANOVA test #python
 0:32:52
Hypothesis testing tutorial using Python in Google Colab
 0:21:43
Z Test and Hypothesis Testing Stats with Python
 0:14:54
Hypothesis Testing, p-value & Confidence Intervals, Exploratory Data Analysis In Python Statisti...
 0:16:48
Hypothesis testing Practical Implementation|Hypothesis testing with data example in python
 0:20:02
Tutorial 33- P Value,T test, Correlation Implementation with Python- Hypothesis Testing
 0:21:18
Statistical Hypothesis Testing- Data Science with Python
 0:32:52
Hypothesis testing tutorial using Python in Google Colab
 0:32:52
Hypothesis testing tutorial using Python in Google Colab
 0:04:00
Hypothesis Testing - Introduction
 0:04:16
Hypothesis Testing and T-test using Python.
 0:00:13
Research Aptitude Part-8 | Types Of Hypothesis | Parametric & Non-Parametric Test | Nta Net Pape...
 0:04:22
Hypothesis Testing in Data Science and P-values with Python | Statistics | Data Science Tutorial
 0:09:18
Hypothesis testing Python
 0:03:21
Independent T Test (ttest) in Python || Hypothesis Testing || Data Science
 0:14:41
Hypothesis Testing and The Null Hypothesis, Clearly Explained!!!
Комментарии