filmov
tv
Regression t-Test for the Slope (Casio fx-9750GII)
Показать описание
- - -
Approximate script:
I'm going to cover how to perform a t-test for the slope of regression line summary using a Casio 9750 graphing calculator, where I'll be checking whether the data provide strong evidence of a non-zero slope. The sample data set I'll use is from a previous video where I described how to draw a scatterplot of the data and compute the y-intercept and slope for a regression using the Casio 9750 calculator.
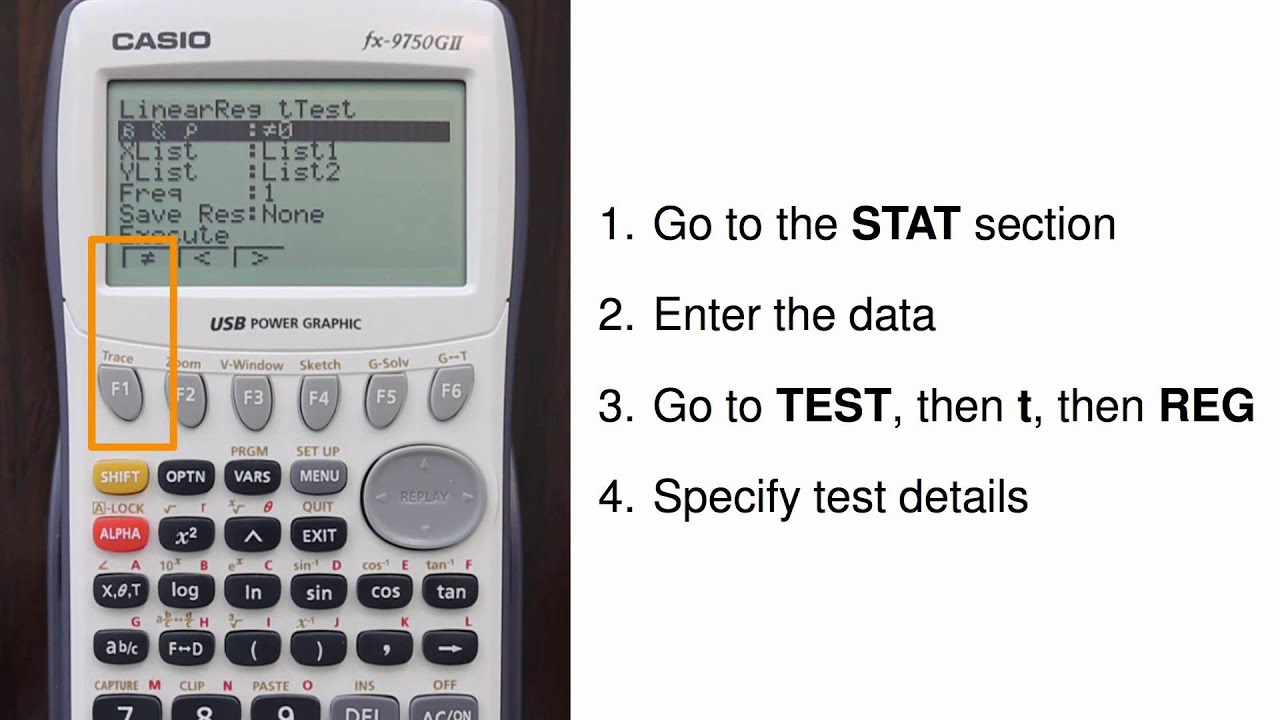
For conducting the t-test for the slope, I'll go to the STAT section by hitting Menu and then hitting 2 for the Stat section.
Next, I'll enter the data into two lists. However, I've already entered the data from the last video, so I'll just go ahead and reuse it for this video.
Since I want to conduct a t-test, I go to TEST, then to T. Since this is a regression context, I navigate to REG for regression. Now I need to specify the alternative hypothesis. Since I want to run a 2-sided test, I'll use "not equals", which is already selected. Next, I specify the lists where the data are located. I prefer to always store my data in Lists 1 and 2, and that's again where I stored these. But had I needed to change a list, I would have navigated down to the list, then hit F1 and entered the list number.
The frequency value should remain at 1, so I can hit the execute key to get the test results.
The output shows
- the alternative hypothesis,
- the t-test statistic,
- the p-value,
- the degrees of freedom for the test statistic,
- the y-intercept,
- the slope, and
- some additional statistics.
The p-value is 8.1e-5, which is about 0.000085, so I reject the null hypothesis and conclude that there is a linear trend in the data.
If you liked this video, give it a thumbs up below and subscribe. Thanks for watching.
 0:07:16
Calculating t statistic for slope of regression line | AP Statistics | Khan Academy
 0:10:21
Doing a T-Test on the Slope Coefficient in Simple Regression
 0:05:33
Perform t test on the slope by hand
 0:05:16
T-Test for the SImple Regression Slope (Module 3 2 2)
 0:01:55
Regression t-Test for the Slope (Casio fx-9750GII)
 0:05:46
Hypothesis Test for Simple Linear Regession
 0:07:33
Ex. Linear Regression (t test for slope)
 0:13:33
Simple Linear Regression - t tests of parameters
 0:07:41
Regression: hypothesis testing of the slope
 0:12:00
Simple Linear Regression, hypothesis tests
 0:21:35
Linear Regression t test and Confidence Interval
 0:07:22
Regression Slope T Test
 0:00:36
t-Test for Slope - Intro to Inferential Statistics
 0:16:07
Linear Regression--Hypothesis Test for Slope
 0:09:50
Linear regression | hypothesis testing
 0:21:35
Linear Regression t test and Confidence Interval Corrected
 0:08:06
Multiple Regression | Coefficients – Interpretation, C.I, Hypothesis Testing
 0:01:16
t-Test for Slope - Intro to Inferential Statistics
 0:05:40
Testing a hypothesis about the slope of a regression line
 0:21:06
Example on T-test to Test Slope and Intercept in Simple Linear Regression Model
 0:14:53
14.2 Simple Linear Regression Testing for Significance
 0:16:51
ST314 Lesson 43: t-test for slope coefficient
 0:10:24
MSIT 3000: t-tests and t-intervals for the regression slope
 0:03:29
Linear Regression T-Test & Interval
Комментарии