filmov
tv
How to Perform Factor Analysis in R | Varimax Rotation

Показать описание
In this video, learn how to perform Factor Analysis (FA) in R Studio to explore underlying patterns in your data. Factor Analysis is a key data reduction technique used to identify latent variables that explain the variance in a large set of observed variables.
This tutorial will guide you through:
Key Concepts: What is Factor Analysis and when to use it in research.
Data Preparation: How to prepare your dataset for Factor Analysis.
Performing Factor Analysis: A step-by-step guide using the psych and factoextra packages in R.
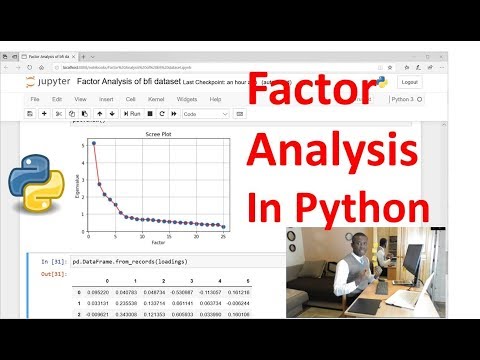
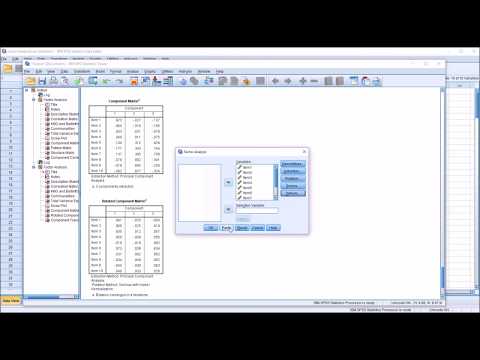
Interpreting Results: Learn how to interpret the factor loadings, eigenvalues, and scree plot to make sense of your data.
Visualization: How to create factor plots for better visualization of your results.
Whether you're working with biological data, this tutorial will help you understand the fundamentals of Factor Analysis in R.
Watch Next:
Disclaimer
This video is made for the sole purpose of higher education. Care is taken to provide the most accurate information. However, we can’t guarantee the accuracy of all the information in this video. Kindly do your own research before coming to any conclusions or making any decisions.
📌 Tags:
#biostatistics #statistics #dataanalysis #statisticalanalysis
#datavisualization #datascience #dataanalytics #datamining #statisticsbio7 #factor #factors #factoranalysis #analysis #varimax #rotation
📚 Resources:
Applying Factor Analysis in Biological Sciences: A Step-by-Step Guide with R
How to Choose the Optimal Number of Factors in Factor Analysis: A Guide Using PCA and Parallel Analysis
Choosing Between Varimax and Promax Rotations in Factor Analysis for Biological Data: A Practical Guide
I offer professional services in data analysis and data visualization, specializing in biostatistics. For more information or to inquire about my services, please contact me at:
🔗 Connect with Us:
Join this YouTube channel membership:
👍 Like, Share, and Subscribe for more content!
This tutorial will guide you through:
Key Concepts: What is Factor Analysis and when to use it in research.
Data Preparation: How to prepare your dataset for Factor Analysis.
Performing Factor Analysis: A step-by-step guide using the psych and factoextra packages in R.
Interpreting Results: Learn how to interpret the factor loadings, eigenvalues, and scree plot to make sense of your data.
Visualization: How to create factor plots for better visualization of your results.
Whether you're working with biological data, this tutorial will help you understand the fundamentals of Factor Analysis in R.
Watch Next:
Disclaimer
This video is made for the sole purpose of higher education. Care is taken to provide the most accurate information. However, we can’t guarantee the accuracy of all the information in this video. Kindly do your own research before coming to any conclusions or making any decisions.
📌 Tags:
#biostatistics #statistics #dataanalysis #statisticalanalysis
#datavisualization #datascience #dataanalytics #datamining #statisticsbio7 #factor #factors #factoranalysis #analysis #varimax #rotation
📚 Resources:
Applying Factor Analysis in Biological Sciences: A Step-by-Step Guide with R
How to Choose the Optimal Number of Factors in Factor Analysis: A Guide Using PCA and Parallel Analysis
Choosing Between Varimax and Promax Rotations in Factor Analysis for Biological Data: A Practical Guide
I offer professional services in data analysis and data visualization, specializing in biostatistics. For more information or to inquire about my services, please contact me at:
🔗 Connect with Us:
Join this YouTube channel membership:
👍 Like, Share, and Subscribe for more content!
 0:15:25
 0:15:03
 0:05:29
 0:11:24
 0:07:42
 0:06:04
 0:22:07
 0:07:07
 0:27:25
 0:12:12
 0:09:50
 0:03:28
 0:13:12
 0:16:12
 0:14:38
 0:00:53
 0:10:41
 0:03:21
 0:56:54
 0:03:19
 0:05:08
 0:30:36
 0:17:02
 0:11:05