filmov
tv
Investigating the Slope of Secant Lines in Desmos

Показать описание
This tutorial shows you how you can graph a function in Desmos, add movable points, and then graph a secant line between those two points. You can even calculate the slope.
Made for the MCV4U Calculus and Vectors course in Ontario.
Made for the MCV4U Calculus and Vectors course in Ontario.
 0:05:02
Investigating the Slope of Secant Lines in Desmos
 0:05:09
Investigating the Slope of Secant Lines in GeoGebra
 0:02:06
Calculus 1: Limits & Derivatives (1 of 27) The Tangent Line and The Secant Line - Reviewed
 1:06:48
Empirical Study of Limits / Slope of Secant and Tangent Line
 0:01:16
1-Minute Math: Slope of a Tangent Line
 0:02:51
Derivatives Investigation
 0:12:24
AP Calculus FRQ
 0:05:08
Slope of Tangent Line
 0:23:52
Limits, Secant/Tangent Lines, and Trigonometry Examples!
 0:08:29
Geogebra Secant slope Help 1
 0:07:17
2.1 Rates and Tangents
 0:15:03
MTH 141 Prep - Secants and Tangents
 0:11:25
Math 1A 2.1 Example 2 Estimating the slope of a tangent line from experimental data
 0:32:46
Definition of Derivative (Part 1) - Slope of Tangent Line In
 0:12:01
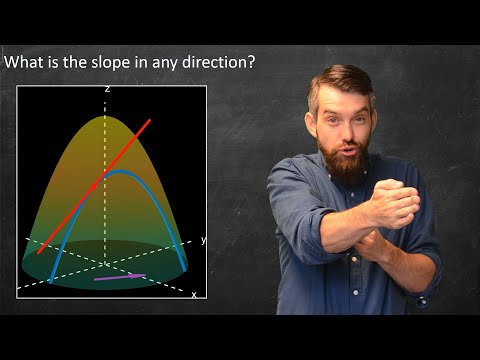
Directional Derivatives | What's the slope in any direction?
 0:07:01
Secant and tangent line example (new)
 0:04:27
Secants and Tangents to Curves
 0:21:54
Calculus 2.5 Using GeoGebra to Investigate the Difference Quotient, Symmetric Difference Quotient, a
 0:41:13
The Tangent Line Problem and the Derivative
 0:07:17
2.1 Rates and Tangents
 0:07:35
3.1 Tangents and the Derivative at a Point
 0:31:30
1.4 Rates of Change and Tangent/Secant Lines Day 1 (AP)
 0:20:12
Derivatives - Part 1: Slopes, Curves, Secants and Tangents
 0:08:22
1.4 Exploring the Tangent Line with Slope (Introduction to Derivatives)
Комментарии