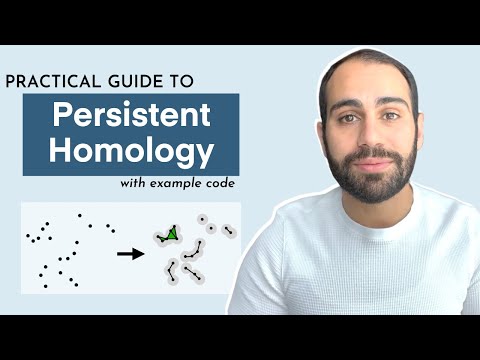
Persistent Homology | Introduction & Python Example Code

preview_player
Показать описание

This is the final video in a 3-part series on topological data analysis (TDA). TDA is an up-and-coming approach to data analysis that studies the shape of data. In this video, I discuss a popular TDA approach called persistent homology.

Resources I found helpful:

--

Introduction - 0:00
Shapes - 0:33
Triangles - 1:02
Simplexes - 1:54
Holes - 2:58
Persistent Homology - 4:14
Persistence Diagrams - 7:03
Example code: Homology of Market Data - 8:58
Рекомендации по теме
Комментарии
Автор

Fascinating video on applying persistent homology to market analysis! I noticed two potential data leakage issues that could affect the results:

In the initial data preparation (around line 29), the log-returns are calculated using future prices: r = np.log(np.divide(P[1:], P[:len(P)-1])). This means each return uses the next day's price, which wouldn't be known at the time.
In the Wasserstein distance calculation loop (around line 46), the second time window r[i+w+1:i+(2*w)+1] uses future data that wouldn't be available at the prediction time.

To fix these, you could calculate returns using only past data and adjust the second window to r[i+1:i+w+1]. These changes would ensure the analysis only uses information available at each point in time.
Great work exploring these advanced techniques! Looking forward to seeing more.

aberobwohl
Автор

Was currently wrestling to understand the concept of persistent homology, and this definitely helped! More power to you, good sir! Really appreciate the effort that you have put onto this video.

abhirupgupta
Автор

Best video on persistent homology for a newbie like me

yxoxz
Автор

Excellent video. Well organized, presented, and explained.

As a mathematician, I have one small nitpick. At 2:58, you use the torus/coffee mug as an example of H_1 = 1. In most mathematical settings, a mathematician referring to a torus as a space would really mean the *surface* of a donut. The surface of a donut, a torus, is actually very different from a simple cycle. H_1(T) has rank 2, and H_2(T) has rank 1. Some refer to this as a "Solid Torus" but solid tori usually do not come up much.

Honestly, this is a very common mishap that probably is us mathematician's fault for using the "donut coffee mug" meme too often and calling them tori without getting into the weeds of what is meant.

acerbic-piglet
Автор

Brilliant presentation Shaw. Thank you!

kambizhomayounfar
Автор

Very helpful and simple to understand, thanks a lot Shaw!!🙏🙏🙏🙏

AmirhosseinHaydarzadehFakhraba
Автор

Love it! Great way to explain it sensei Shawhin!

ging
Автор

Friendly intro, i recommend having a practical full proven useful example in hand as well

chefmemesupreme
Автор

Love all your videos on data, so well explained and makes complex topics so simple to understand! Thanks so much!!! 🔥

benedicttiu
Автор

You did a great job explaining a complex topic👏👏👏👏

KongQuestCo
Автор

great video!

but i dont understand the part where u mention to ignore the blue topological feature at 8:25. can u rephrase your sentence?

yjhbsk
Автор

Great example. I wouldn't say "predict" if the wasserstein distance is estimated using future information.

profmiked
Автор

Thank you. I would like to also know a bout multiparameter persistent homology

torhbert
Автор

Thanks! Great video.
When you've computed the homology groups (H0, H1, H2) of all data points over increasing values for ε (a ball around points) 7:03, how do you plot them in the persistance diagram 8:52?
Does each point represent a connected component (H0), loop (H1) or enclosed surface (H2)? If its on the diagonal then it is born and dies relatively shortly after each other? And in the code example you are only considering one homology group, so either H0, H1 or H2 12:10?

TheTessatje
Автор

Fascinating and beautiful, thanks. But there will always be some pattern in data. The question is whether past structures help predict future ones. And would we understand why some past structure leads the real world changes? Practically all indicators in technical analysis rely on some kind of causal hypothesis that would help explain its predictive success (if such there be....)

training
Автор

Is there any meaning behind using days as points, instead of using series of prices itself as points? It seems kinda weird that when calculating persistent homologies we're growing radii of balls centered around points in time

kieserel
Автор

You need to write an article in the medium about persistent homology.

kirekadan
Автор

Thanks for the video. Could you draw any parallels between mapper and PH diagrams? For example, would cover in mapper be similar to ε?

ShrutiBhatporia
Автор

Thank you for the video. I have a question, when you plot the persistance diagram what are the units that the birth and death axes use?

felixmartinez
Автор

Is there a paper or a resource for the last example?

kurokane
visit shbcf.ru