filmov
tv
Graph Functions and Relations - Algebra 2 - Math

Показать описание
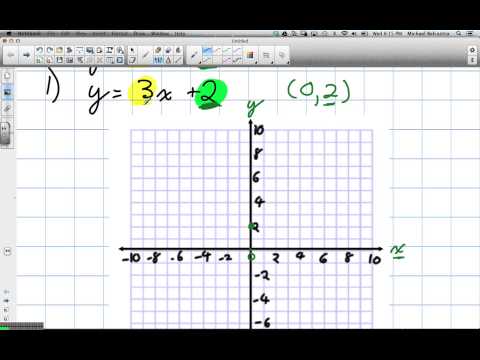
How to graph functions and linear equations.
In this tutorial, we'll be learning how to graph the equation y + 2x = 1 on the coordinate plane. This equation represents a line in the two-dimensional space and by plotting its points, we can visualize the slope and intercept of the line. We'll be using the slope-intercept form of a line to help us find the slope and y-intercept and plot the line on the graph.
Don't miss out on this opportunity to enhance your math skills and become a graphing pro! Hit the like button and subscribe for more math tutorials. Get ready to impress your classmates, teacher, or coworkers with your newfound knowledge!
#mathematics #maths #algebra2 #graphs #functionsandrelations #class10 #class10th #mathtutorial #graphingequations #linearalgebra #mathskills #y+2x=1 #mathmadeeasy #coordinateplane #slopeinterceptform #mathtips #studentresources
 0:04:19
Functions vs Relations on a Graph
 0:04:07
Graphical relations and functions | Functions and their graphs | Algebra II | Khan Academy
 0:01:34
Graph Functions and Relations - Algebra 2 - Math
 0:06:57
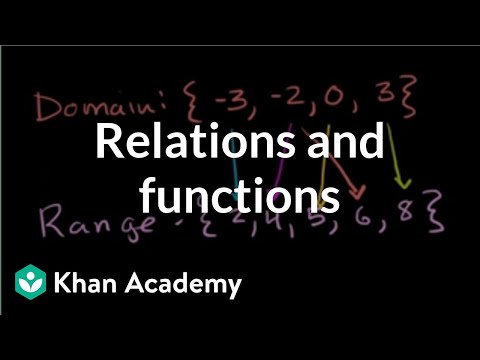
Relations and functions | Functions and their graphs | Algebra II | Khan Academy
 0:12:27
Relations and Functions | Algebra
 0:05:36
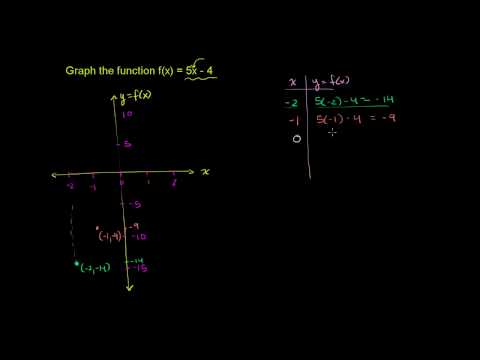
Graphing a Basic Function
 0:05:28
Intro to Graphing Functions and Function Tables
 0:11:34
Algebra Basics: What Are Functions? - Math Antics
 0:09:43
Learn Functions – Understand In 7 Minutes
 0:11:00
Relations, Functions, and Graphs-A Review
 0:03:06
Functions: Determine if the graph is a function or not.
 0:02:48
GCSE Maths - What are Quadratic Graphs? #76
 0:07:57
What is a function? | Functions and their graphs | Algebra II | Khan Academy
 0:10:54
Functions - Vertical Line Test, Ordered Pairs, Tables, Domain and Range
 0:22:46
Learning Functions and Relations easy lesson ||Chris Maths Academy
 0:03:32
Drawing Graphs of Functions (GMAT/GRE/CAT/Bank PO/SSC CGL) | Don't Memorise
 0:26:18
06 - What is a Function in Math? (Learn Function Definition, Domain & Range in Algebra)
 0:05:05
The graphical relationship between a function & its derivative (part 1) | Khan Academy
 0:13:16
HOW TO GRAPH FUNCTIONS/RELATIONS with DOMAIN & RANGE- || TAGALOG || Easy Steps with Teacher Math...
 0:10:14
Algebra Basics: Graphing On The Coordinate Plane - Math Antics
 0:05:36
Connecting f, f', and f'' graphically | AP Calculus AB | Khan Academy
 0:08:56
How to Graph Linear Relations Grade 9 Academic
 0:02:43
Domain and range of a relation | Functions and their graphs | Algebra II | Khan Academy
 0:13:24
Domain and Range of a Function From a Graph
Комментарии