filmov
tv
Displaying Data Notes (Types, Graphical Displays, Shapes)

Показать описание
Learn about different types of data (numerical or categorical), Graphical displays (bar graph, circle graph, dotplot, stemplot, histogram), shapes (symmetrical, uniform, right skewed, left skewed, bimodal). Prep for AP Statistics test.
Read Bar Graphs
Mosaic Plots
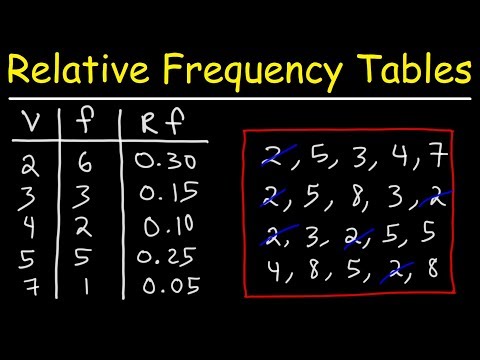
Reading Dot Plots and Frequency Tables
Create Histogram
Read Histogram
Reading Stem and Leaf Plots
Shape of Distributions
Read Bar Graphs
Mosaic Plots
Reading Dot Plots and Frequency Tables
Create Histogram
Read Histogram
Reading Stem and Leaf Plots
Shape of Distributions
 0:18:08
 0:02:07
 0:10:22
 0:27:21
 0:05:09
 0:02:09
 0:23:19
 0:01:35
 0:16:42
 0:13:10
 2:12:19
 0:00:27
 0:10:20
 0:07:57
 0:00:28
 0:12:41
 0:13:24
 0:18:01
 0:00:36
 0:13:00
 8:15:04
 0:00:32
 0:15:43
 0:05:05