filmov
tv
Horizontal Analysis - Meaning, Formula, Calculation & Interpretations

Показать описание
In this tutorial, we'll go over the finer details of Horizontal Analysis, including its formulas and step-by-step calculations. Following that, we will conduct a horizontal analysis of the Colgate Case Study and interpret the findings.
What is Horizontal Analysis?
--------------------------------------------
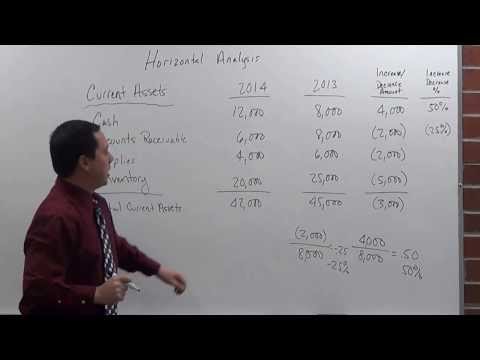
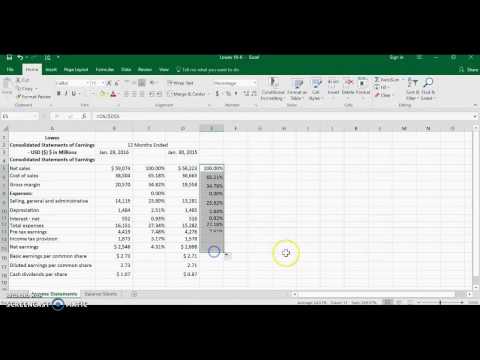
Horizontal analysis, also known as trend analysis, refers to the percentage change in the same line item of a financial statement in the next accounting period compared to the value of the baseline accounting period. Horizontal analysis can be performed on any of the item in the income statement, balance sheet and statement of cash flows.
Formula
--------------------------------------------
Horizontal Analysis formula = [(Amount in comparison year – Amount in the base year)/ Amount in a base year] x 100
Advantages of Performing Horizontal Analysis
--------------------------------------------
• Horizontal analysis helps evaluate trends year over year (YoY) or quarter over quarter (QoQ), for example, how much has the revenue increased over the years.
• It enables investors to view and compare actual data for consecutive years.
• Horizontal analysis is simple to interpret. It does not require any special financial skill to understand the difference between the previous year's data and the current data.
To know more about Horizontal Analysis in Finance, you can go to this link:
Connect with us!
What is Horizontal Analysis?
--------------------------------------------
Horizontal analysis, also known as trend analysis, refers to the percentage change in the same line item of a financial statement in the next accounting period compared to the value of the baseline accounting period. Horizontal analysis can be performed on any of the item in the income statement, balance sheet and statement of cash flows.
Formula
--------------------------------------------
Horizontal Analysis formula = [(Amount in comparison year – Amount in the base year)/ Amount in a base year] x 100
Advantages of Performing Horizontal Analysis
--------------------------------------------
• Horizontal analysis helps evaluate trends year over year (YoY) or quarter over quarter (QoQ), for example, how much has the revenue increased over the years.
• It enables investors to view and compare actual data for consecutive years.
• Horizontal analysis is simple to interpret. It does not require any special financial skill to understand the difference between the previous year's data and the current data.
To know more about Horizontal Analysis in Finance, you can go to this link:
Connect with us!
 0:12:32
Horizontal Analysis - Meaning, Formula, Calculation & Interpretations
 0:06:26
Horizontal Analysis
 0:12:21
Horizontal analysis of financial statements
 0:03:11
Horizontal and Vertical Analysis Methods | Principles of Accounting
 0:08:37
Horizontal Analysis on the Balance Sheet & Income Statement
 0:02:58
Financial Analysis: Horizontal Analysis Example
 0:10:03
Horizontal Analysis of Financial Statements
 0:05:01
Horizontal Analysis
 1:22:26
20240925_NLED (Masahiro Suzuki)
 0:04:12
How to do Horizontal Analysis
 0:05:30
Horizontal Analysis | Financial Statement Analysis
 0:11:22
Trend Analysis - Meaning, Formula, Calculation & Interpretations
 0:11:17
Horizontal Analysis of Balance Sheet | Explained with Example
 0:04:42
Horizontal Analysis
 0:15:52
Horizontal analysis of Financial statements (Income statement analysis) - Part 1
 0:03:10
Financial Statement Analysis - Horizontal Analysis, Vertical Analysis, and Ratio Analysis Overview
 0:04:43
Creating Vertical & Horizontal Analysis Statements Company Projects
 0:12:24
Horizontal Analysis of Income Statement | Explained with Example | Excel
 0:17:01
Vertical Analysis - Meaning, Formula, Calculation & Interpretations
 0:00:56
Horizontal analysis vs vertical analysis
 0:23:57
FINANCIAL RATIOS: How to Analyze Financial Statements
 0:03:04
Differences between Horizontal and Vertical Financial Analysis.
 0:06:59
Quick Horizontal Analysis in Excel: Income Statement & Balance Sheet
 0:07:33
Horizontal Analysis - Dollar and Percentage Change
Комментарии