filmov
tv
Descriptive Statistics in R Programming | Best R Programming Tutorial for Beginners | @henryharvin

Показать описание
🔥Henry Harvin R Programming course (Use code “YOUTUBE20”)
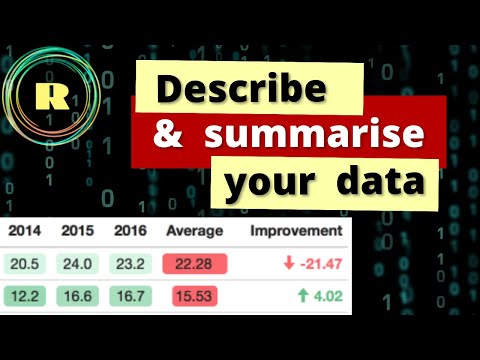
This Henry Harvin video on “Descriptive Statistics in R Programming” is a complete Descriptive Statistics in R Programming tutorial for beginners who want to learn Descriptive Statistics in R Programming. Descriptive statistics are used to summarize data in a way that provides insight into the information contained in the data. This might include examining the mean or median of numeric data or the frequency of observations for nominal data. It is a measure of the values of the data. In Descriptive analysis, we are describing our data with the help of various representative methods like using charts, graphs, tables, excel files, etc. In the descriptive analysis, we describe our data in some manner and present it in a meaningful way so that it can be easily understood.
Henry Harvin Course with Completion Certificate:
---------------------------------------------------------------------------
✅ 𝐅𝐨𝐥𝐥𝐨𝐰 𝐇𝐞𝐧𝐫𝐲 𝐇𝐚𝐫𝐯𝐢𝐧 𝐄𝐝𝐮𝐜𝐚𝐭𝐢𝐨𝐧 𝐎𝐧𝐥𝐢𝐧𝐞 for more information, visit:
---------------------------------------------------------------------------
🔴 Subscribe to our channel to get the latest video Updates:
🔴 Check out more R Programming course Tutorials:
#Henryharvin #BestOnlineRProgramminglcourseTutorialForBeginners #RProgrammingcourse #RProgrammingcourse #RProgrammingcourse #RProgramming
#rprogramming #pythonprogramming #programming #programminglanguage #programminglove #programminglife #programmingstudents #javaprogramming #programmingislife #programminglanguages #programmingjokes #crossfitprogramming #programmings #learnprogramming #programmingquotes #cprogramming #programmingisfun #programminghumour #webprogramming #programminghumor #programmingmemes #cncprogramming #datascience #computerprogramming #rprogramming #programmingcontest #warriorprogramming #programmingfacts #python
#DescriptiveStatisticsinRProgramming
𝐀𝐛𝐨𝐮𝐭 𝐭𝐡𝐞 𝐂𝐨𝐮𝐫𝐬𝐞:
Henry Harvin RProgramming course certification is Ranked 1 in the industry by BNC.com.
One of our very best courses in Data Analytics, the R programming for Data Science Course from Henry Harvin® covers foundational R programming concepts such as data types, vectors, and indexing as well as introduces participants to performing data operations in R including Data wrangling, and making plots | R Programming for Data Science guarantees your success as a Data Scientist! Amongst the best R Programming for Data Science Courses in India currently, this is one of Henry Harvin’s signature training, where a lot of time and resources have been carefully invested in ensuring only the most relevant knowledge, is imparted to students R Programming for Data Science given upon successful completion of the course will be endorsed by Henry Harvin® which has affiliations from the American Association of EFL, UK Cert, UKAF, MSME & Govt of India or Trainers are well versed in the subject matter with 10+ Experience. They Focus on giving Learner Industry Graded Projects, as per the Curriculum during the training for Practical and In-Depth Learning of the Subject Matter
Key Features:
✅ Recognised Certification
✅ Integrated Curriculum
✅ 100% Practical Training
✅ Gain Experience of 12+ Projects
✅ Job guidance and 1-year support of Analytics academy
✅ Trusted by 160+ Corporates and 60+ Colleges
✅ Become Eligible for jobs demanding an Analytics background.
✅ Fill the void of thousands of untapped High-Paying Jobs.
✅ Open doors to Job Opportunities Abroad demanding specialization.
✅ Improve your CV & Linkedin Profile with technical & professional development.
👉 𝐑𝐞𝐚𝐜𝐡 𝐮𝐬 𝐨𝐮𝐭:
Helpline No.: +91 9015266266
Whatsapp: +91-9891953953
---------------------------------------------------
 0:06:11
 0:12:10
 0:03:02
 0:04:13
 0:15:49
 0:15:03
 0:05:25
 0:05:16
 0:19:44
 0:20:28
 0:03:43
 0:25:51
 0:38:56
 0:10:57
 0:05:59
 0:18:52
 0:13:40
 0:03:59
 0:03:13
 0:05:55
 0:20:02
 0:03:57
 0:13:38
 0:22:40